Implementation of FP-growth algorithm using Python
FP-growth algorithm is an improved version of the Apriori algorithm used for Association Rule Mining from the database. The Apriori algorithms have two significant drawbacks: speed and high computational cost. To overcome these drawbacks, you can use a much faster FP-growth algorithm. This article will cover the FP-growth algorithm implementation using Python and Jupyter Notebook at AWS SageMaker Studio.
Table of contents
FP-growth algorithm overview
FP-growth algorithm is a tree-based algorithm for frequent itemset mining or frequent-pattern mining used for market basket analysis. The algorithm represents the data in a tree structure known as FP-tree, responsible for maintaining the association information between the frequent items.
The algorithm compresses frequent items into an FP-tree from the database while retaining association rules. Then it splits the database data into a set of conditional databases (a special kind of projected database), each of which is associated with one frequent data item.
FP-tree
FP-tree is the core concept of the FP-growth algorithm. The FP-tree is a compressed representation of the database itemset, storing the DB itemset in memory and keeping track of the association between items.
The tree is constructed by taking each itemset and adding it as a subtree. The FP-tree’s whole idea is that items that occur more frequently will be more likely to be shared.
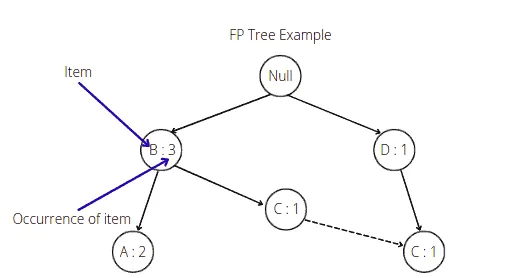
The root node in the FP-tree is null. Each node of the subtree stores at least the item name and the support (or item occurrence) number. Additionally, the node may contain a link to the node with the same name from another subtree (represents another itemset from the database).
Building FP-tree
The FP-growth algorithm uses the following steps to build FP-tree from the database.
- Scan itemsets from the database for the first time
- Find frequent items (single item patterns) and order them into a list
Lin frequency descending order. For example,L = {A:5, C:3, D;2, B:1} - For each transaction order its frequent items according to the order in
L - Scan the database the second time and construct FP-tree by putting each frequency ordered transaction onto it
To illustrate algorithm steps, let’s take a sample database and create an FP-tree out of it:
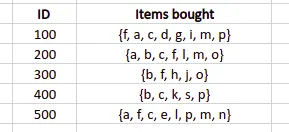
The first step is to scan the dataset, create a frequency table containing each item from the database, and arrange them in descending order. We also need to specify the minimum support (number of item occurrences). The algorithm will not put items with a support value less than the minimum support into the frequency table. For example, let’s set up the minimum support value equal to 3. In that case, we will get the following frequency table:
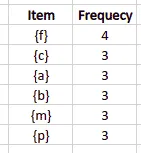
Note: The algorithm did not include all items with frequency more minor than the minimum support value in the frequency table.
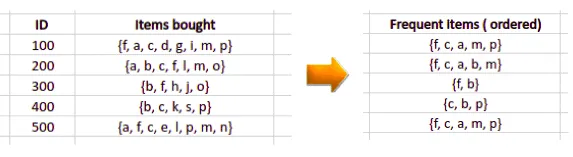
The next step is to scan the database the second time and arrange elements based on the frequency table:
- items with higher a frequency number will come first
- if two items have the same frequency number they will be arranged in alphabetical order
Now, we are ready to build the FP tree.
We will start with a null node, and then based on the frequent items table, we will add nodes to the tree.
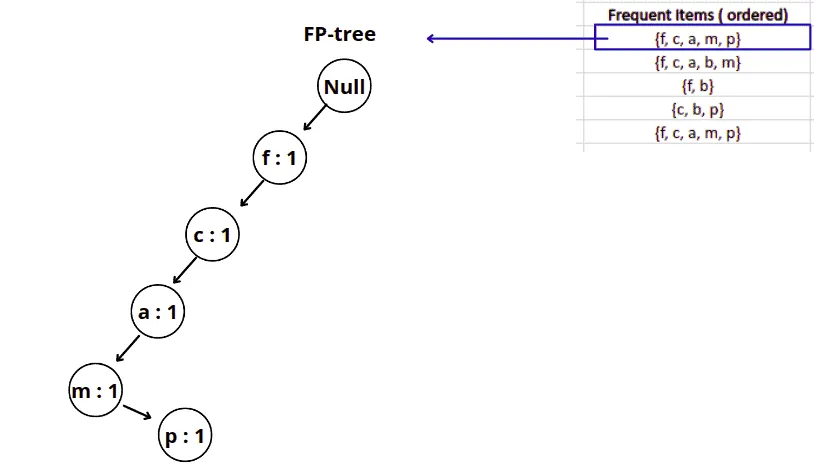
For example, here’s how the FP-growth will construct the FP-tree for the first frequent item from the list:
Similarly, the next step will add the following item from the list to the FP-tree as shown below:
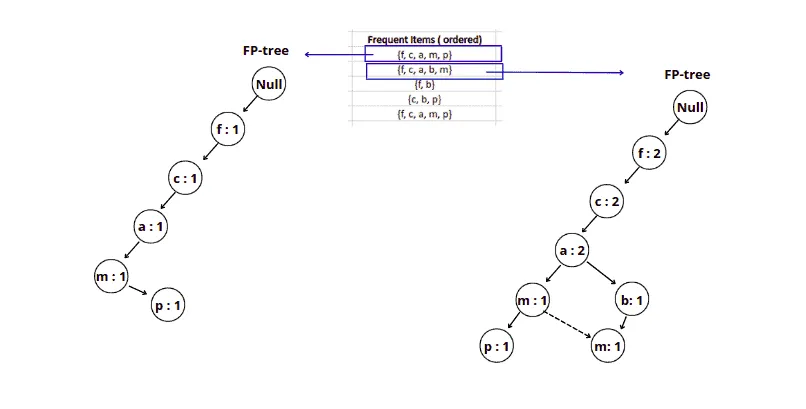
Note: As we add the same element to the tree, we increment the support. But after item a we created a new node for item b because there was no item b in our initial tree after item a. And we have linked items m together because this is the same element located in different subtrees.
Similarly, we add other items from the frequent items table to the FP-tree.
Here’s our final FP tree:
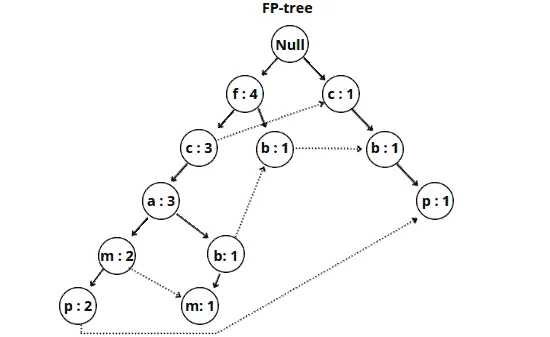
The FP tree is ready. Based on this tree, the FP-growth algorithm can create different association rules.
Building association rules
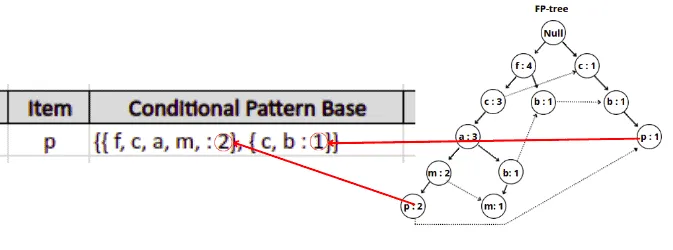
Once the FP-growth algorithm constructed the FP-tree, it can build different associations rules based on the minimum support value. It will take the item with the minor support count and trace that item through the FP-tree to achieve that goal.
In our example, the item p has the lowest support count, and the FP-growth algorithm will produce the following paths:
{ {f, c, a, m, p : 2}, {c, b : 1} }.
Note: The item p is located in two different subtrees of the FP-tree, so the algorithm traced both paths and added the minimum support value for every path.
Similarly, the FP-growth will build the conditional pattern base table for all of the items from the FP-tree.
The final conditional pattern base table for all elements in our example looks like this:
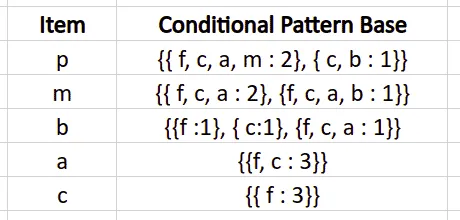
The next step is to get all items from the Conditional Pattern Base column that satisfy the minimum support requirement.
Let’s calculate elements’ occurrences for the p item:
{ f, c, a, m : 2 }, { c, b : 1 } - > { f: 2, c:3, a:2, m:2, b:1 }
Only item c appears three times and satisfies the minimum support requirement. That means the algorithm will remove all other items except c.
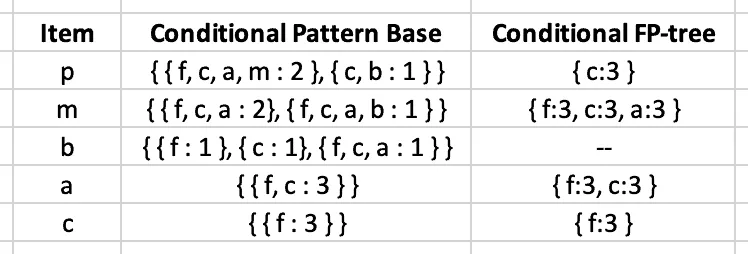
After removing items that do not meet the minimum support requirement, the algorithm will construct the following table:
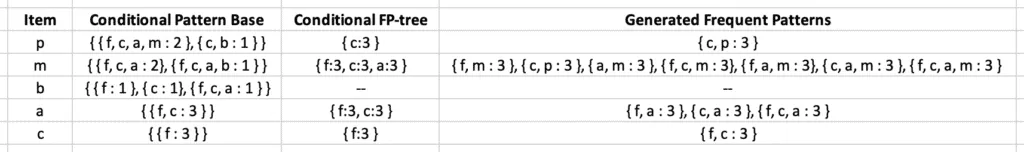
The final step of creating association rules is to generate frequent patterns by pairing the items of the Conditional FP-tree column with the corresponding item from the Item column.
For example, for the first row, the algorithm needs to take { c:3 } from the Conditional FP-tree column, create its combination with the p element and add the support count value. Similarly, the FP-growth algorithm will generate frequent patterns (or association rules):
Implementation of FP-growth algorithm using Python
Let’s implement the FP-growth algorithm using Python language. Run the following commands in the cell of the Jupyter Notebook to install the required modules:
%pip install pandas
%pip install numpy
%pip install plotly
%pip install mlxtend
Once these libraries are installed, we can implement the FP algorithm.
Importing and Exploring dataset
To illustrate the implementation of the FP-growth algorithm, we will use the market-basked optimization dataset, which you can download from here.
Let’s now import the dataset using pandas module and print out the number of columns and rows to know the size of the dataset.
# importing module
import pandas as pd
# dataset
dataset = pd.read_csv("Market_Basket_Optimisation.csv")
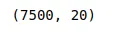
# printing the shape of the dataset
dataset.shapeOutput:
We can print the columns and a few rows to get familiar with the type of data that it contains.
# printing the columns and few rows using head
dataset.head()
Output:
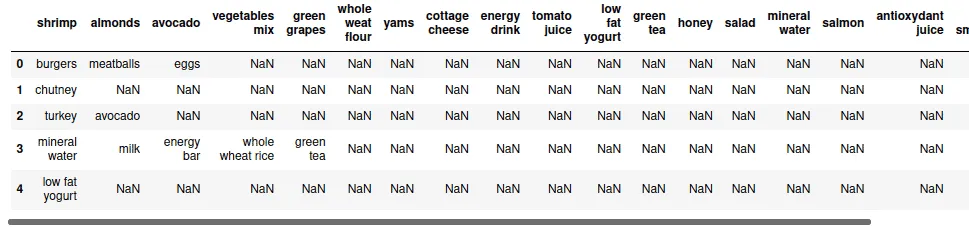
The next step is to store all purchased items in a NumPy array because there are a lot of null values in the dataset, and it isn’t easy to understand which item has been purchased.
# importing module
import numpy as np
# Gather All Items of Each Transactions into Numpy Array
transaction = []
for i in range(0, dataset.shape[0]):
    for j in range(0, dataset.shape[1]):
        transaction.append(dataset.values[i,j])
# converting to numpy array
transaction = np.array(transaction)
print(transaction)
Output:

Now, our data is in NumPy array format. We can now remove all the null values and print out the top 5 frequently occurring items.
#  Transform Them a Pandas DataFrame
df = pd.DataFrame(transaction, columns=["items"])
# Put 1 to Each Item For Making Countable Table, to be able to perform Group By
df["incident_count"] = 1
#  Delete NaN Items from Dataset
indexNames = df[df['items'] == "nan" ].index
df.drop(indexNames , inplace=True)
# Making a New Appropriate Pandas DataFrame for Visualizations
df_table = df.groupby("items").sum().sort_values("incident_count", ascending=False).reset_index()
#  Initial Visualizations
df_table.head(5).style.background_gradient(cmap='Blues')
Output:
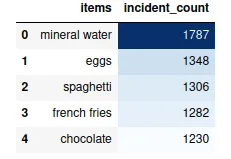
So, these are the top 5 most purchased items by customers.
We can also use treemap to visualize the purchased items in more detail using the Plotly module. Let us visualize the top 50 items using treemap.
# importing required module
import plotly.express as px
# to have a same origin
df_table["all"] = "Top 50 items"
# creating tree map using plotly
fig = px.treemap(df_table.head(50), path=['all', "items"], values='incident_count',
                  color=df_table["incident_count"].head(50), hover_data=['items'],
                  color_continuous_scale='Blues',
                )
# ploting the treemap
fig.show()
Output:
Pre-processing dataset
We need to convert our dataset to true and false values. For example, if the transaction contains an item, we will put the true, and if there is no transaction, we will fill it with the false.
First, we will gather all the transactions and convert them into a NumPy array.
# Transform Every Transaction to Seperate List & Gather Them into Numpy Array
transaction = []
for i in range(dataset.shape[0]):
    transaction.append([str(dataset.values[i,j]) for j in range(dataset.shape[1])])
# creating the numpy array of the transactions
transaction = np.array(transaction)
# importing the required module
from mlxtend.preprocessing import TransactionEncoder
# initializing the transactionEncoder
te = TransactionEncoder()
te_ary = te.fit(transaction).transform(transaction)
dataset = pd.DataFrame(te_ary, columns=te.columns_)
# dataset after encoded
dataset.head()
Output:
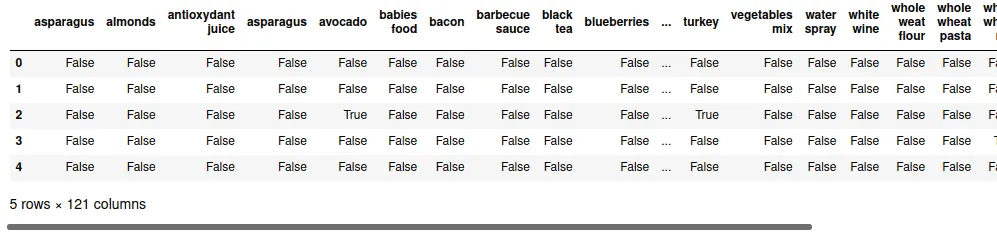
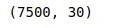
As you can see, there are 121 items/features. Extracting the frequent items from 121 will be compelling, so we will select the top 30 items and apply the FP-growth algorithm to find the most frequent items.
# select top 30 items
first30 = df_table["items"].head(30).values
# Extract Top 30
dataset = dataset.loc[:,first30]
# shape of the dataset
dataset.shape
Output:
Implementing FP growth Algorithm
Our dataset is now ready, and we can implement an FP growth algorithm to find the frequent occurring items by setting minimum support to 0.05.
#Importing Libraries
from mlxtend.frequent_patterns import fpgrowth
#running the fpgrowth algorithm
res=fpgrowth(dataset,min_support=0.05, use_colnames=True)
# printing top 10
res.head(10)
Output:
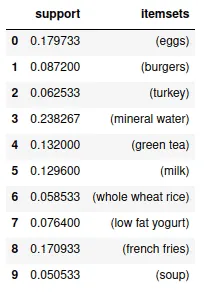
Now, we can create different associations rules from these frequently occurring elements.
# importing required module
from mlxtend.frequent_patterns import association_rules
# creating asssociation rules
res=association_rules(res, metric="lift", min_threshold=1)
# printing association rules
res
Output:
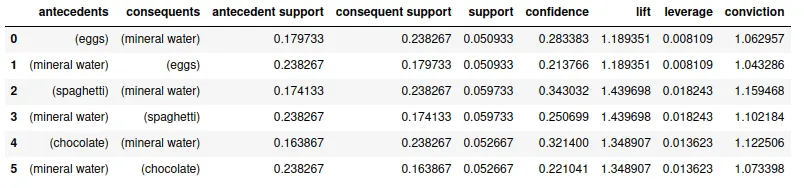
We can get different association rules depending on the value of support, confidence, and lift. For example, in the given table, we can see that {spaghetti}->{mineral water} is mostly like to occur as we observe it from the lift.
We can also arrange the items to know which items are more related. For example, we will sort the given association rule by confidence.
# Sort values based on confidence
res.sort_values("confidence",ascending=False)
Output:
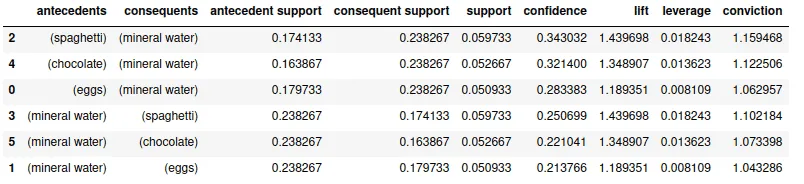
The output shows that {spaghetti} -> {mineral water} has the highest confidence, and they are more related to each other.
Summary
FP-growth is an improved version of the Apriori algorithm, widely used for frequent pattern mining. It is an analytical process that finds frequent patterns or associations from data sets. This article explained the FP-growth algorithm and covered its implementation using Python.
