Serverless Monitoring Solutions For Your Applications
As technology evolves, businesses get greater access to solutions for fast application development. A leading example of such solutions is Serverless computing. Its model challenges and transforms traditional methods of software development and operations. This article covers various Serverless monitoring solutions (commercial and open-source) that you may use in your projects.
Table of contents
What To Monitor
Application Performance Monitoring (AMP) plays an integral role in Serverless applications because typical application data and business logic are spread across numerous services and APIs. To maintain optimal Serverless application characteristics, you must address observability for every process within your project. The right monitoring solution is a crucial aspect that provides information on how the deployed serverless application performs and whether it guarantees real business value.
Usually, when we’re speaking about monitoring individual service or application components, we mean several things:
- Logs
- Performing metrics
- Cost
And usually, we want those things to be:
- Collected
- Processed and analyzed
- Alerted
- Archived
In addition, most Serverless applications are very complicated because of their distributed nature, so it is vital to mention distributed transaction monitoring. This monitoring shows how all your application components interact in a distributed cloud environment.
What Metrics Are Important
We always need to know how our application is working. Our expectations are based on specific criteria.
These criteria usually include:
- Errors – we measure what percent of overall events or requests in our system are processed incorrectly.
- Latency – we measure how much time it takes to process a request.
- Traffic – we measure the total number of requests the resource or API endpoint is processing.
These indicators allow us to identify errored services, performance degradation across resources, and scaling issues hit by higher traffic rates.
AWS provided us with a comprehensive list of Lambda invocation, performance, and concurrency metrics, which need to consider whatever monitoring solution you choose.
For most Serverless applications, the core technology usually chosen is AWS Lambda, GCP Cloud Functions, or Azure Functions.
Those managed cloud services are complemented by fully-featured logging, monitoring, and alerting services like Amazon CloudWatch, AWS X-Ray, Google Cloud Monitoring, or Azure Application Insights.
Using those services, engineers and developers usually do:
- Tracing transactions in distributed serverless environments.
- Profiling to study performance and cold starts.
- Observe logs for errors and abnormal behavior patterns (CloudWatch Insights, Google Cloud Monitoring).
AWS provides a Dead Letter Queue (DLQ) feature for their Lambda functions and monitoring capabilities. You can quickly and easily capture events not processed by the Lambda function in SNS or SQS and react to them later or immediately.
Serverless Monitoring Solutions
Let’s start our list with monitoring services every cloud provider provides. Then we jump to a big list of 3rd party platforms available for you.
Amazon CloudWatch

Amazon CloudWatch is a comprehensive monitoring solution and standard de facto in the AWS cloud platform. It can provide you with data and actionable insights about every component of your application stack.
Amazon CloudWatch is also integrated with all AWS services and allows you to construct your custom Dashboards, where you can put any monitoring metrics. It gives you almost unlimited monitoring capabilities, optimizing your service and resource utilization and getting a unified view of operational health.
CloudWatch allows you to collect metrics not only for AWS infrastructure but for on-premises infrastructure as well.
Because of its deep integration with all AWS services, especially AWS Lambda, you can automate remediation actions based on configurable alarms. For example, if somebody unintentionally opened it to the outside world, you call the Lambda function to make the S3 bucket private.
CloudWatch Logs Insights allows you to explore, analyze, and visualize your logs. So you can troubleshoot your operational problems with ease.
CloudWatch is integrated with IAM, and you can control which users and resources have permission to access your data and how they can access it. It is crucial if you have strict security compliance requirements.
AWS X-Ray

AWS X-Ray is an essential service designed for distributed monitoring of all your cloud applications, services, and components. It is beneficial in analyzing, debugging, and tracking of performance bottlenecks.
All you need to do is to add X-Ray SDK to your application. Most of the metrics and monitoring information are available out of the box. For detailed tracing information, some code changes may still be required. X-Ray SDK supports C#, Python, Java, Go, Ruby, and Node.js.
The process is simple. Your Lambda functions or other application service components send trace data to X-Ray, which examines the information to produce a service map and trace statements.

Google Cloud Monitoring
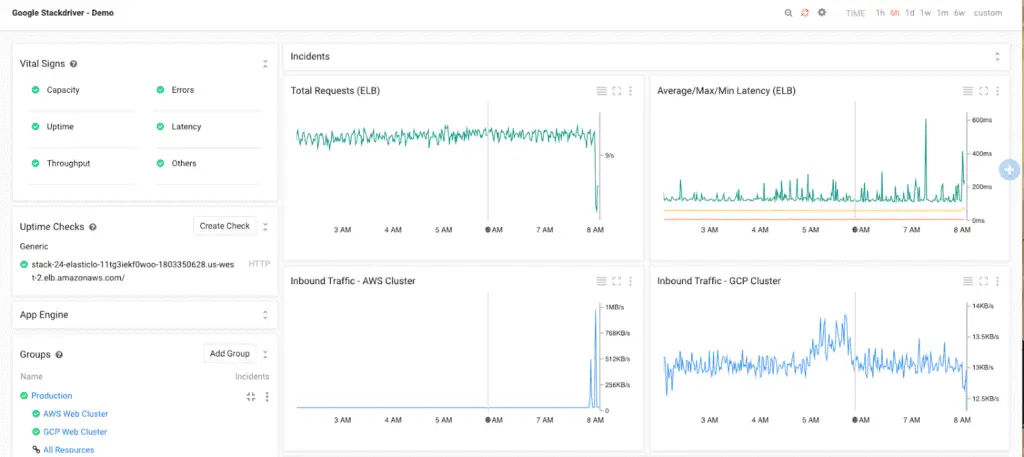
If you’re using the Google Cloud Platform, you are familiar with Google Cloud Monitoring (formerly Stackdriver). This platform helps you to solve logging and monitoring problems within GCP. Google Cloud Platform offers essential information about the service’s health, availability, performance, and more. Troubleshooting and resolving issues in GCP have become quick and straightforward.
Google Cloud Platform processes this data and delivers insights through charts, dashboards, and alerts. The Logging feature makes it possible to store, search, and assess your resources on Amazon Web Services and GCP. Some examples of AWS-supported services:
- EC2.
- EBS.
- S3.
- ELB.
- Lambda.
- etc.
Stackdriver solution consists of several significant services or components:
- Logs Viewer – solution to supervise logs.
- Error Reporting – a solution to aggregate and show errors generated by your cloud services.
- Cloud Debugger – tool examines the state of a particular application at any code location while the application demonstrates optimal performance.
- Cloud Trace gathers latency data from App Engine applications that the GCP Console then shows in real-time.
- Cloud Profiler consistently collects CPU consumption and memory allocation information from production apps.
Azure Application Insights

Azure Application Insights is an extensible Application Performance Management (APM) service for developers and DevOps professionals suited for monitoring live applications. It will automatically detect performance anomalies and include powerful analytics tools to help you diagnose issues and understand what users do with your app.
It works for apps on various platforms, including .NET, Node.js, Java, and Python, hosted on-premises, hybrid, or any public cloud infrastructure. It integrates with your DevOps process and has connection points to various development tools.
Application Insights is aimed at the development team to help you understand how your app is performing and how it is used.
It can provide you visibility on the:
- Request rates, response times, and failure rates.
- Dependency rates, response times, and failure rates.
- Exceptions.
- Pageviews and load performance.
- AJAX calls from web pages.
- User and session count.
- Performance counters.
- Host diagnostics.
- Diagnostic trace logs from your app.
- Custom events and metrics.
Thundra
Thundra provides tracing, profiling, monitoring, and alerting capabilities that help administrators understand and manage the aggregate set of distributed services.
Thundra was purpose-built to address these constraints, providing the end-to-end application visibility and management required to go quickly and safely.
Thundra is aimed at developers to:
- Rapidly troubleshoot and debug applications quickly.
- Understand and manage costs.
- Automate continuous configuration, enforcement, and verification of security and compliance controls.
- Reduce context-switching across multiple tools.
- Understand application behavior using fine-grained cardinality.
- Integrate alerts and actions with workflows and systems.
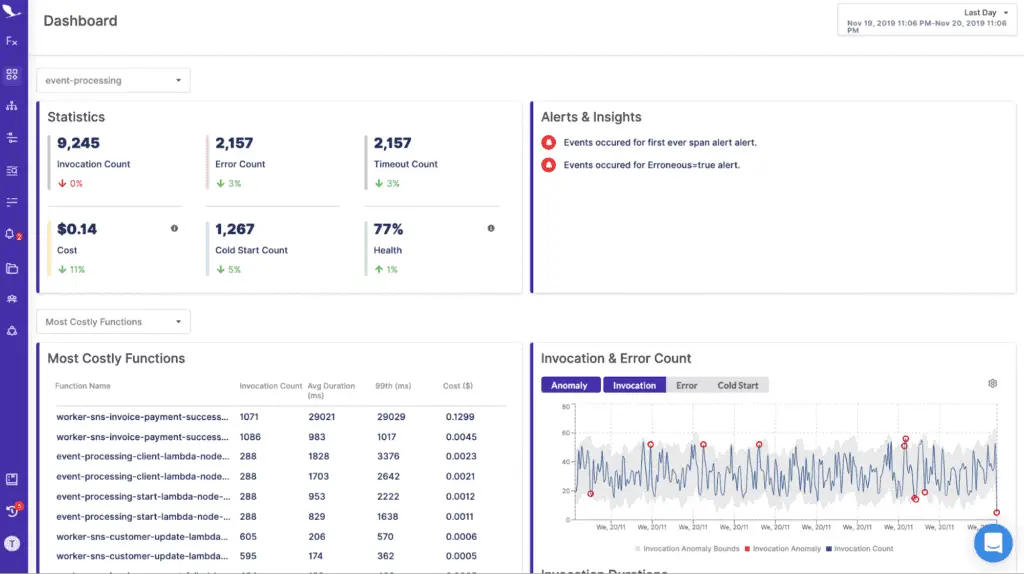
Thundra provides you with several handy interfaces for:
- Display and filter all your deployed functions.
- Summarized view of a project’s Lambda functions at a glance (statistics, alerts and insights, lists of functions, and charts with anomalies).
By its nature, serverless architecture is a distributed microservice cloud. That makes it hard to review and monitor serverless architectures. Thundra can discover your entire architecture and show all interactions between your resources, such as DynamoDB, Redis, SQS, and your Lambda functions.
DataDog Lambda Monitoring

To make modern application architectures more observable, you can consider using Serverless monitoring in Datadog (GA). It allows you to search, filter, and explore all your Lambda functions in one place and jump straight into detailed performance data for each of them.
Datadog Serverless monitoring improves application infrastructure observability with features that dynamically search, filter, and explore AWS Lambda functions.
Here are the platform capabilities:
- Distributed traces help actively resolve performance bottlenecks and filter serverless traces.
- It lets you observe core business operations by gathering real-time, business-specific metrics from serverless functions.
- You can achieve complete visibility and transparency with the Service Map. This feature visualizes Lambda functions with Amazon S3, API Gateway, DynamoDB, and similar dependencies.
The benefits of these efficiencies are clear:
- A single console displays every function, allowing enterprises to aggregate business-critical metrics and examine an invocation with only one click.
- Effortlessly and rapidly address issues that disrupt performance. Users also have the option to critically analyze their serverless architecture with elements like seamless tracing and flame graphs.
- Achieve Serverless functions observability and simplify incident diagnoses with nearly zero-wait time.
SignalFX (Splunk)

SignalFx’s Microservices APM offers unique insights into distributed applications to enable application performance monitoring, troubleshooting, and root-cause analysis through end-to-end distributed tracing.
Leveraging SignalFx’s advanced metrics and analytics capabilities, SignalFx Microservices APM automatically identifies the right traces to retain for problem isolation and data exploration while also capturing 100% of metrics for all spans and traces.
SignalFx Microservices APM (Application Performance Monitoring) is the tool DevOps teams need to innovate faster in the cloud, deliver flawless user experience, and future-proof their applications.
You can Monitor infrastructure performance in real-time at a cloud scale through predictive streaming analytics with data from any cloud, vendor, and service.
APM offers automatic instrumentation for the following programming languages: Java, Scala, Kotlin, Python, Ruby, Node.js, Golang, PHP, .NET Core, and .NET Framework,
SignalFx Microservices APM unique capabilities:
- Never miss an anomaly – To deliver a flawless end-user experience, you must observe everything. With NoSample™ full-fidelity trace ingestion, leverage all your trace data to identify any anomaly.
- AI-driven analytics and directed troubleshooting – Reduce MTTR with Directed Troubleshooting to quickly understand service dependencies, correlation with underlying infrastructure, and root-cause error mapping.
- High cardinality exploration of traces – Breakdown and explore any transaction by any metric or dimension. Quickly and easily understand how your application behaves for different regions, hosts, versions, or users.
- Open Standards Approach – Capable of ingesting and storing high resolution, low latency data at a massive scale, SignalFx Microservices APM collects data from a wide range of client libraries and cloud integrations, open-source auto or manual instrumentation.
Dashbird

Dashbird introduces observability into Serverless applications by employing log analysis, tracing, system monitoring, and failure detection. The widespread AWS Lambda monitoring debugging platform provides account, service, and function-level features to optimize cost, performance, and business resources. Software and application development is quick, and CloudWatch logs deliver in-depth analytics. Furthermore, the two-minute setup process requires no code changes.
Top benefits include, but are not limited to:
- Automated Alert System – Your enterprise serverless services receive complete and automatic alert coverage. Identifying runtime bottlenecks, receiving metric alarms, and searching for configuration issues have become very simple.
- End-To-End Architecture Observability – Monitoring cloud apps is seamless, and the experience is unrivaled. Users can navigate between metrics, logs, configuration, and tracing data without delay. This feature eliminates the need to sift through CloudWatch logs to figure out the root cause of an issue.
- Insights Engine – Detecting hidden issues is often a problem for businesses because it wastes time and effort. Dashbird Insights Engine proactively addresses this and puts forth best practices to enhance app health.
- Simple Deployment – Ask any developer about the IT anxiety of complex deployment instruments and practices; they will share many stories. Dashbird simplifies things with its easy-to-setup and navigates the platform, allowing companies to focus on more critical IT initiatives.
Epsagon

Epsagon’s platform allows IT teams to spend less time troubleshooting and fixing issues faster by providing automated data correlation, payloads, and end-to-end observability through your environments. With our lightweight agent SDK, Epsagon provides automated instrumentation and tracing without gaps in coverage, giving you full visibility for containers, VMs, serverless, and more with no training, manual coding, tagging, or maintenance required.
Epsagon applies distributed tracing and advanced AI algorithms to automatically detect complete transactions throughout an organization’s system, calculate costs, and offer an end-to-end view of application performance monitoring. It utilizes automatic instrumentation and does not ask users for any code changes.
Features of Epsagon.
- No heavy agents.
- No tagging is required.
- Instant setup.
- Scalability out of the box.
- Interactive, customizable architecture view.
- Troubleshooting and tracing of application performance issues.
- No need for tedious, manual log searching.
Epsagon integrations:
- Run in any modern cloud.
- Run across any production and any workload.
- Epsagon is integrated with Serverless Framework, Pulumi, Slack, PagerDuty, EventBridge, Jira, GitHub, and many others.
Epsagon has additional features, such as:
- Automatic discovery of your applications stack – allows you to see performance metrics for any production resource for Kubernetes, ECS, and Lambda without any manual work.
- Epsagon also automatically maps the discovered application stack into a highly visual architecture view called a Service Map.
- With Trace Search, pinpoint the problem even faster. Query and search any call using criteria such as name, time, resource, exception, user ID, or payload.
- Manage alerts and issues in one interface called the Issues Manager, which aggregates and correlates production data so you can manage and alert faster.
- Easily set up alerts from the pre-selected categories (alert types, entities) or customize your notifications.
New Relic
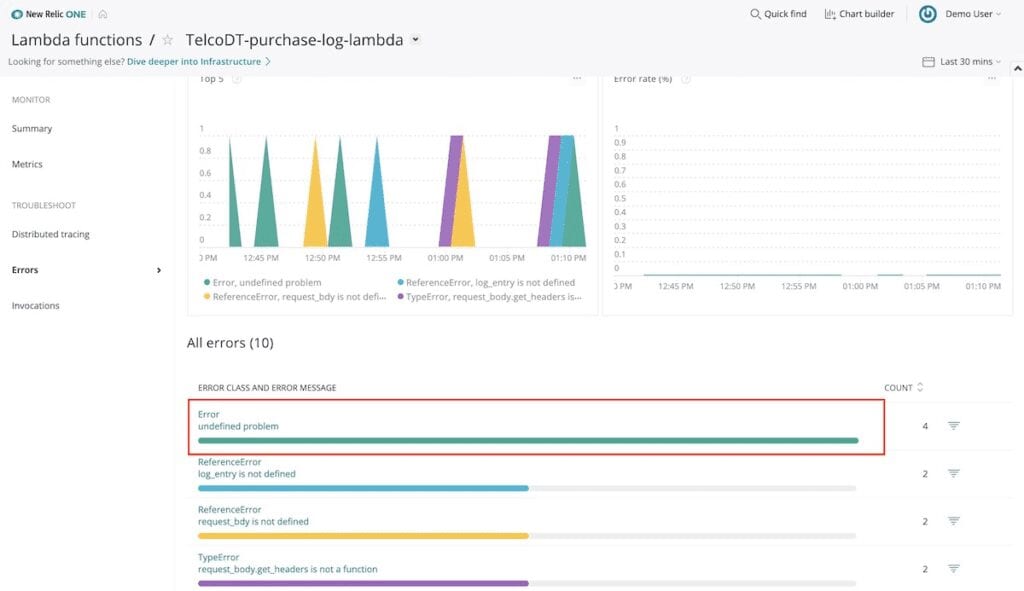
New Relic One is an observability platform built to help engineers create perfect software. From traditional monoliths to microservices and serverless components, you can Monitor, visualize, troubleshoot, and alert on all your Lambda functions in a single experience.
- Monitor overall activity across your entities and drill into specific functions in the friendly UI.
- See detailed telemetry about function execution and data about connected components.
- Observe all your event data along with spans.
New Relic provides comprehensive monitoring for an industry-leading seven languages: Java, Node.Js, Python, Go, .NET, PHP, and Ruby. There’s also a native C/C++ agent to instrument and monitor applications written in C/C++ or other languages not supported.
See a curated overview for each instance type, including information and inventory from all AWS accounts and regions in a single view.
- Distributed tracing is essential in the troubleshooting experience since it lets you dig into the communication pipe between the AWS Lambda function and any other artifact the function talks to during its execution.
- Inventoried Tags and Metadata – We retrieve information from your AWS entities, allowing you to filter and facet down to the team or specific metadata attributes on the function configuration or invocation itself.
- Facet Builder.
- High cardinality invocation data – View throughput, detailed categorized AWS Lambda performance metrics like duration, cold starts, error rate, and more at any transaction percentile.
- AWS CloudWatch Metrics.
- Custom attributes and custom events – Capture and send custom attributes or events and tag their function invocations.
- Rich error analysis.
AppDynamics Serverless APM

AppDynamics Serverless Application Performance Monitoring (Serverless APM) for AWS Lambda gives you visibility into the performance of your application’s components that run as functions on serverless compute environments.
Serverless APM correlates business transactions between AWS Lambda functions and:
- Components instrumented with AppDynamics app agents.
- Devices instrumented with AppDynamics End User Monitoring (EUM) agents.
AppDynamics app agents automatically discover the most common application frameworks and services. Agents collect application data and metrics using built-in application detection and configuration settings to build flow maps.
AppDynamics works with popular programming languages such as Java, NET, Node.Js, PHP, Python, C/C++, and more, enabling you to: Troubleshoot problems such as slow response times and application errors.
Additionally, Serverless APM correlates business transactions through serverless functions, such as an AWS Lambda function that invokes another function.
Some exciting features of AppDynamics Serverless APM:
- Serverless APM in the Controller – When business applications contain serverless functions, the Controller experience differs slightly in flow maps, dashboards and metric browser pages, and health rules.
- Flow Maps – Flow maps are a dynamic visual representation of your monitored environment’s components and activities.
- Dashboards and Metric Browser Pages – You can view AWS Lambda functions on your application dashboards and metrics pages. All functionality is identical to that which you would get with any other tier type, except node-level granularity.
- Health Rules – When you configure a health rule for an application of serverless functions, you can monitor the serverless tiers or business transactions that originate in or flow through the serverless functions.
Jaeger

Jaeger is a distributed tracing system released as open source by Uber Technologies. It is used for monitoring and troubleshooting microservices-based distributed systems, including:
- Distributed context propagation.
- Distributed transaction monitoring.
- Root cause analysis.
- Service dependency analysis.
- Performance/latency optimization.
Built with OpenTracing support from inception, Jaeger includes OpenTracing client libraries in several languages, including Java, Go, Python, Node. js, C++ and C#. It is a Cloud Native Computing Foundation member project.
Main Jaeger features:
- Open Source – You may install Jaeger yourself in your environment.
- High Scalability – Jaeger backend is designed to have no single points of failure and to scale with the business needs. For example, any given Jaeger installation at Uber is typically processing several billion spans per day.
- Native support for OpenTracing – Jaeger backend, Web UI, and instrumentation libraries have been designed from the ground up to support the OpenTracing standard.
- Multiple storage backends – Jaeger supports two popular open-source NoSQL databases as trace storage backends: Cassandra 3.4+ and Elastic search 5.x/6.x/7.x.
- Modern Web UI – Jaeger Web UI is implemented in Javascript using popular open-source frameworks like React.
- Cloud-Native Deployment – Jaeger’s backend is distributed as a collection of Docker images.
- Observability.
- Backward compatibility with Zipkin – it is recommended to instrument applications with OpenTracing API and binding to Jaeger client libraries to benefit from advanced product features.
- Topology Graphs – Jaeger UI supports service graphs: System Architecture and Deep Dependency Graphs.
Summary
In the digital era, Serverless technologies play a vital role in the continuous modernization of cloud applications. They open you to practically limitless possibilities. At the same time, they bring additional challenges to your cloud operations.
In exchange for the ability to quickly execute code in response to any events at any scale and write secure short-lived functions in numerous programming languages, it became a bit more challenging to keep track of what’s going on. Thankfully, you have something to choose from to start.