Amazon Cloudwatch is an AWS service that allows you to monitor your services and applications metrics and store and analyze their logs. The ability to add custom metrics and logs considerably aids in integrating logs from third-party software, even from inside the virtual machines. The Boto3 library provides a convenient wrapper around the CloudWatchLogs API, Cloudwatch API, and EventBridge API. This Boto3 CloudWatch tutorial covers how to manage CloudWatch logs, metrics, alarms, and dashboards in Python.
Table of contents
Working with CloudWatch logs using Boto3
The CloudWatch Logs centralizes the collection and storage of logs from different applications and AWS services. You can filter through and explore the logs generated based on selected fields and dimensions in a CloudWatch console.
To cover a few basics:
- Log groups and Log streams: A Log Group is a group of log streams sharing the same properties. It is a logical grouping of log streams. For instance, consider a CRM application that consists of front-end and back-end components. Each component may produce different logs, such as a web server, application logs, etc. So, the CRM application is a log group, whereas the frontend, backend, and other logs are to be log streams.
- Log events: are the granular packets of data that carry a timestamp and textual information about the activity. Log events are sent to Log streams.
To mimic the real system, we will generate dummy log events in the upcoming sections. We will use the Boto3 library to manipulate the Log groups and streams. To do that, we’ll be using the CloudWatch Logs client. You’ll find all code examples down below
Here’s how you can initialize the CloudWatch Logs Boto3 client in your Python code (a Python script or AWS Lambda):
import boto3
AWS_REGION = "us-west-2"
client = boto3.client('logs', region_name=AWS_REGION)
Later, we’ll use this client object to call the other functions related to CloudWatch Logs APIs.
Creating CloudWatch log group
To create a log group, you need to use the create_log_group() method of theCloudWatch Logs client and provide the name of the log group and the tag information as parameters.
It is also recommended to set a retention period for the created log group to one of the following integers representing the days: [1, 3, 5, 7, 14, 30, 60, 90, 120, 150, 180, 365, 400, 545, 731, 1827, 3653].
You can set the retention period for the log group using the put_retention_policy() method of the CloudWatch Logs client.
In the following code example, we will create two log groups named as CRMBackendLogs and CRMFrontendLogs:
import boto3
import json
AWS_REGION = "us-west-2"
client = boto3.client('logs', region_name=AWS_REGION)
retention_period_in_days = 5
# Back end Log Group
log_group = 'CRMBackendLogs'
response = client.create_log_group(
    logGroupName=log_group,
    tags={
        'Type': 'Back end',
        'Frequency': '30 seconds',
        'Environment': 'Production',
        'RetentionPeriod': str(retention_period_in_days)
    }
)
print(json.dumps(response, indent=4))
response = client.put_retention_policy(
          logGroupName=log_group,
          retentionInDays=retention_period_in_days
)
print(json.dumps(response, indent=4))
# Front end Log Group
log_group = 'CRMFrontendLogs'
response = client.create_log_group(
    logGroupName=log_group,
    tags={
        'Type': 'Front end',
        'Frequency': '30 seconds',
        'Environment': 'Production',
        'RetentionPeriod': str(retention_period_in_days)
    }
)
response = client.put_retention_policy(
          logGroupName=log_group,
          retentionInDays=retention_period_in_days
)
This generates the following output:
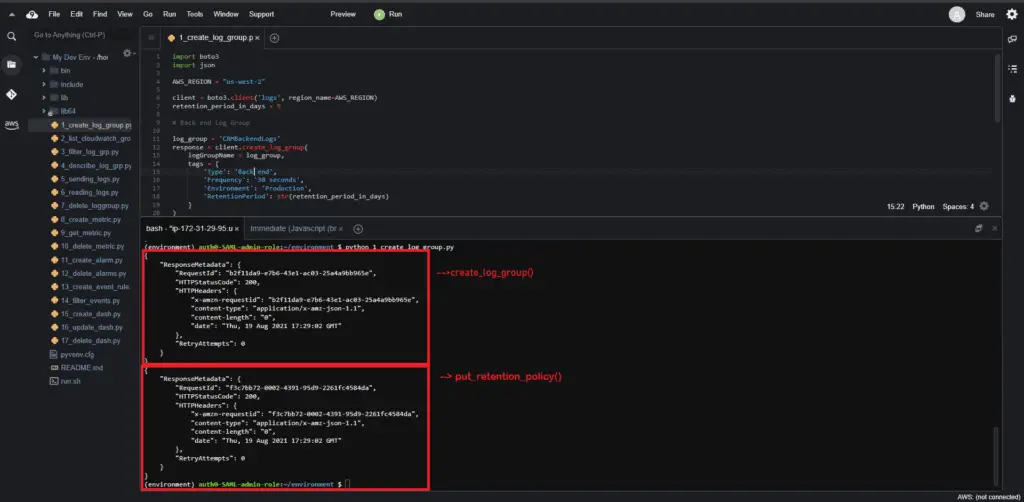
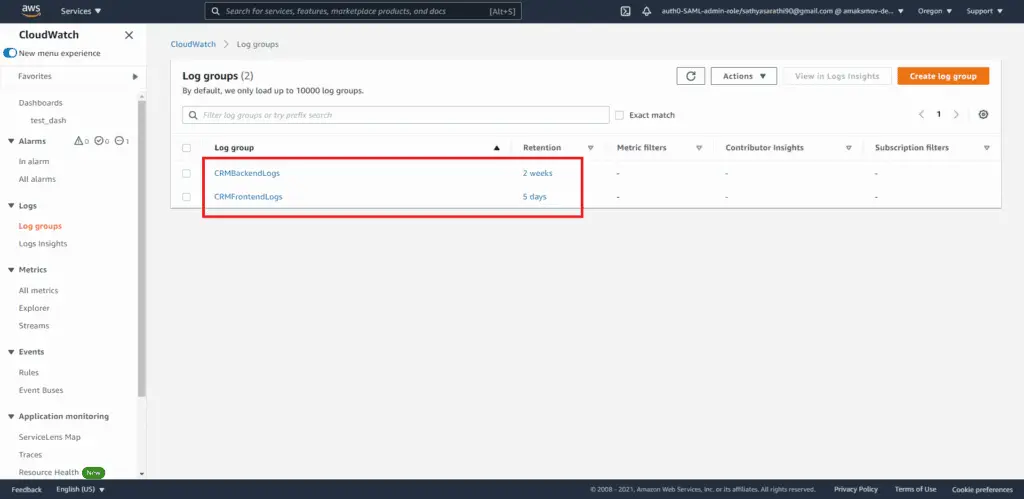
The Logs tab hosts the Log groups in the CloudWatch console, as shown in the image below:
Listing CloudWatch log groups
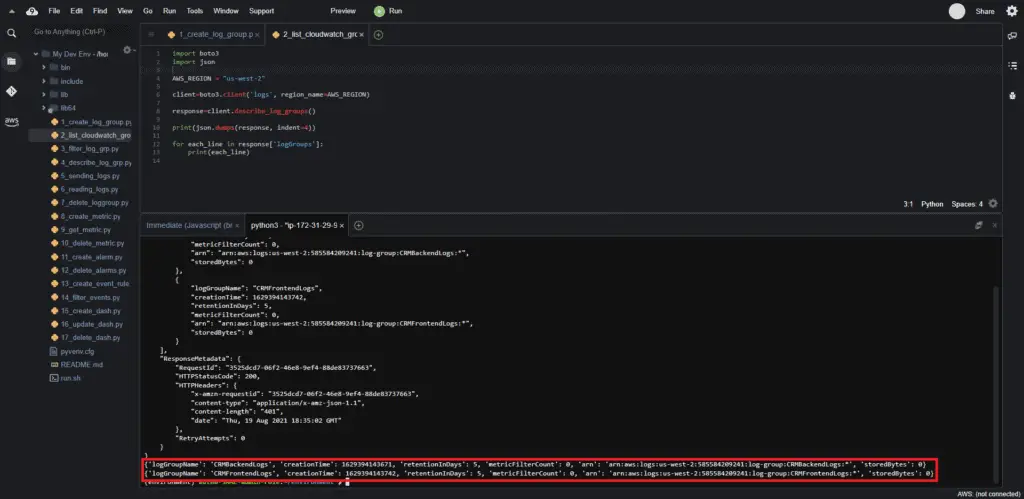
In the previous section, we created two log groups. The existing log groups can be listed by executing the describe_log_groups() method of the CloudWatch Logs client. The method response will contain a list of log groups.
The following code will list all the log groups present in ClouddWatch:
import boto3
import json
AWS_REGION = "us-west-2"
client = boto3.client('logs', region_name=AWS_REGION)
response = client.describe_log_groups()
print(json.dumps(response, indent=4))
for each_line in response['logGroups']:
    print(each_line)
The results in the following output depict the log groups present in this region:
Filtering CloudWatch log groups
You can filter the log groups based on the prefix of their names by adding the logGroupNamePrefix argument to the describe_log_groups() method of the CloudWatch Logs client.
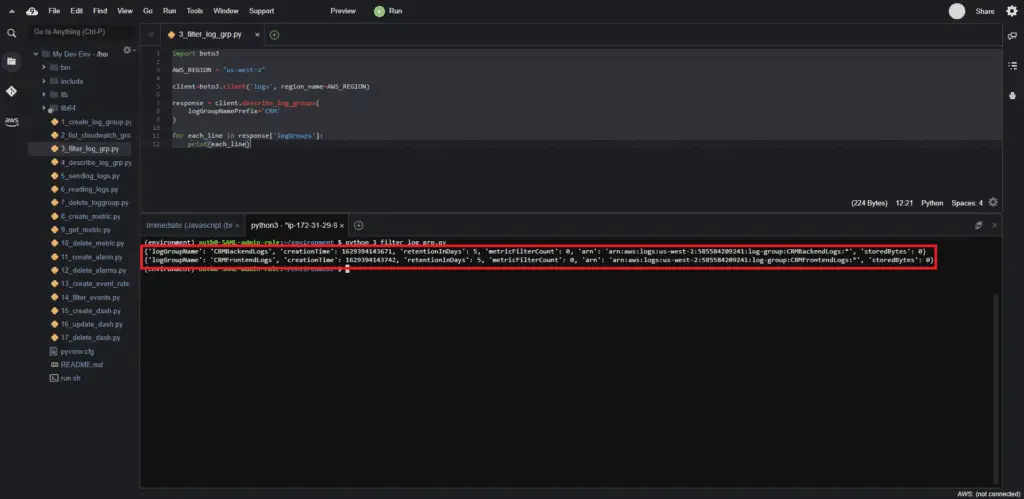
In the following code, we’ll filter the log groups related to our emulated CRM application:
import boto3
AWS_REGION = "us-west-2"
client = boto3.client('logs', region_name=AWS_REGION)
response = client.describe_log_groups(
    logGroupNamePrefix='CRM'
)
for each_line in response['logGroups']:
    print(each_line)
Upon execution of the above code, you’ll get the log groups that start from the CRM prefix:
Describing CloudWatch log groups
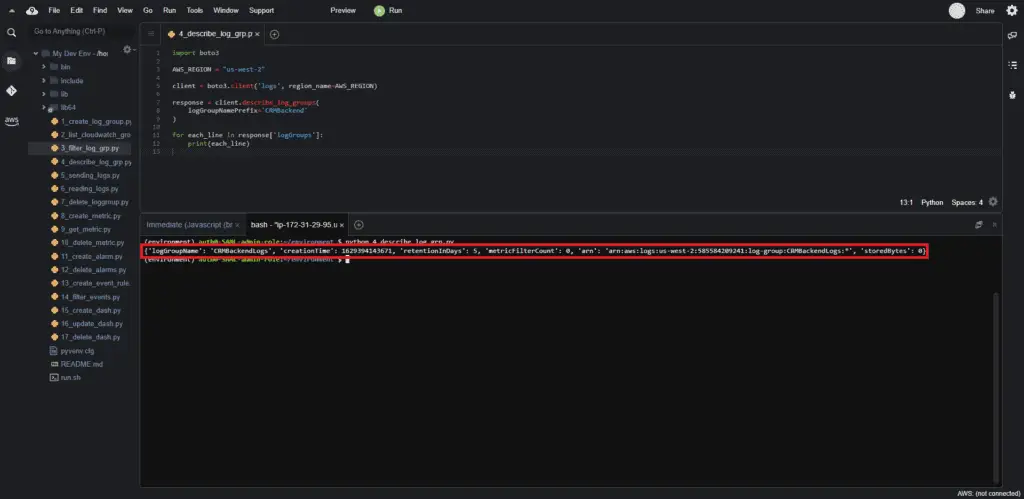
The describe_log_groups() function is quite handy for filtering and describing log groups. The usage is similar to that of the previous examples.
In the following code, we’ll describe log groups:
import boto3
AWS_REGION = "us-west-2"
client = boto3.client('logs', region_name=AWS_REGION)
response = client.describe_log_groups(
    logGroupNamePrefix='CRMBackend'
)
for each_line in response['logGroups']:
    print(each_line)
Each line’s output results in describing each log group:
Sending logs to CloudWatch log group
Now, let’s generate and send the log events (or metric data) to log streams in Cloud Watch. You can create Log Streams by using the create_log_stream() method of the CloudWatch client:
client.create_log_stream(
    logGroupName = 'CRMBackendLogs',
    logStreamName = 'ApplicationLogs'
)
You can publish your log events once you have a log stream. To do this, you must use the put_log_events() method of the CloudWatch Logs client. This method takes three arguments: logGroupName, logStreamName and a list containing logEvents.
response = client.put_log_events(
    logGroupName = 'CRMBackendLogs',
    logStreamName = 'ApplicationLogs',
    logEvents=[
        {
            'timestamp': int(round(time.time() * 1000)),
            'message': messages[random.randint(0, 3)]
        }
    ]
)
Consecutive calls to the API need to use the sequence token from response['nextSequenceToken'].
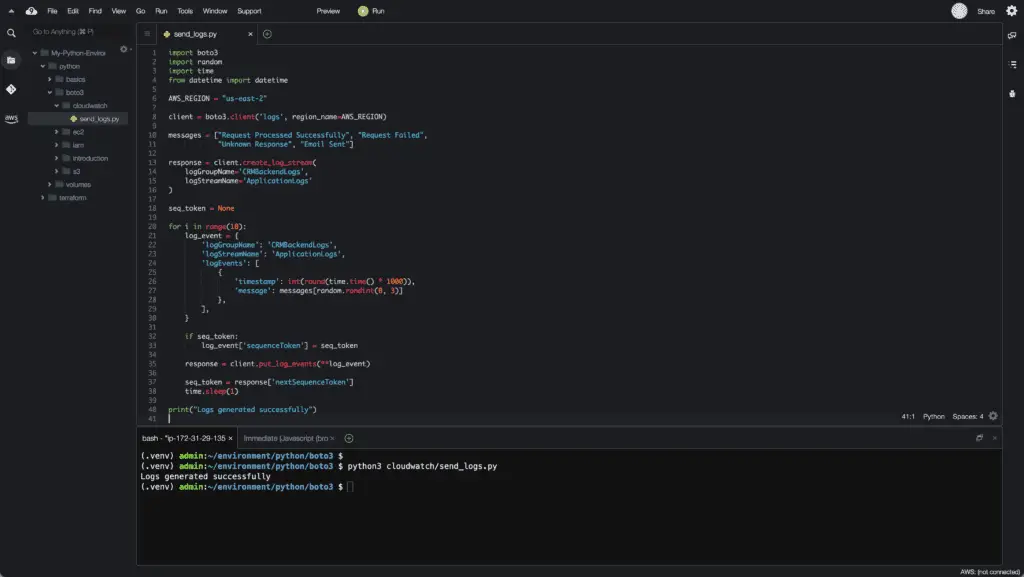
Let’s summarize everything and publish logs to CloudWatch:
import boto3
import random
import time
from datetime import datetime
AWS_REGION = "us-west-2"
client = boto3.client('logs', region_name=AWS_REGION)
messages = ["Request Processed Successfully", "Request Failed",
            "Unknown Response", "Email Sent"]
response = client.create_log_stream(
    logGroupName='CRMBackendLogs',
    logStreamName='ApplicationLogs'
)
seq_token = None
for i in range(10):
    log_event = {
        'logGroupName': 'CRMBackendLogs',
        'logStreamName': 'ApplicationLogs',
        'logEvents': [
            {
                'timestamp': int(round(time.time() * 1000)),
                'message': messages[random.randint(0, 3)]
            },
        ],
    }
    if seq_token:
        log_event['sequenceToken'] = seq_token
    response = client.put_log_events(**log_event)
    seq_token = response['nextSequenceToken']
    time.sleep(1)
print("Logs generated successfully")
Here’s an execution output:
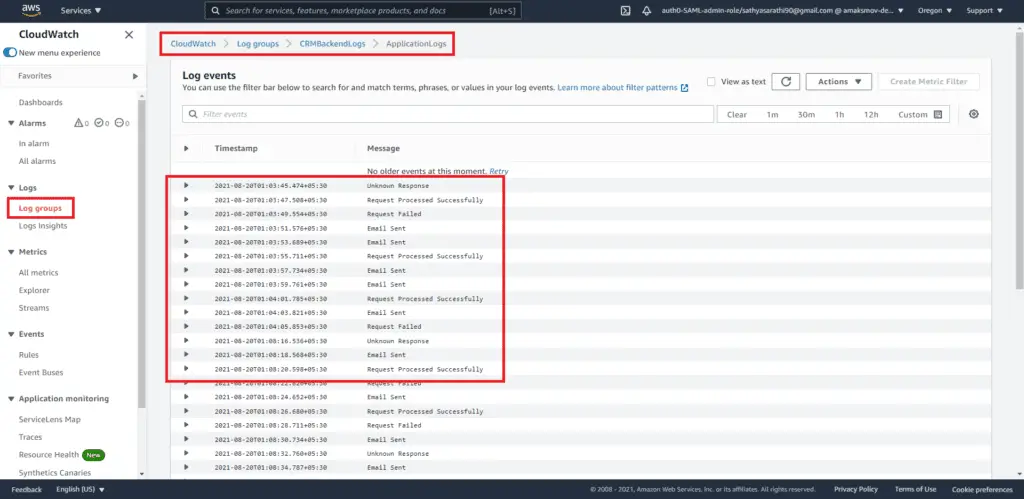
Here’s what the console looks like with the ingested logs:
Reading logs from CloudWatch
You can read ingested CloudWatch logs using the get_log_events() method while providing the log group, log stream name, and start and end time. You can also read the logs from their earliest checkpoint.
The following code reads the log events and prints them on the terminal:
import boto3
import random
import datetime
AWS_REGION = "us-west-2"
client = boto3.client('logs', region_name=AWS_REGION)
response = client.get_log_events(
logGroupName='CRMBackendLogs',
logStreamName='ApplicationLogs',
startTime=int(datetime.datetime(2021, 8, 19, 0, 0).strftime('%s'))*1000,
endTime=int(datetime.datetime(2021, 8, 20, 0, 0).strftime('%s'))*1000,
limit=123,
startFromHead=True
)
log_events = response['events']
for each_event in log_events:
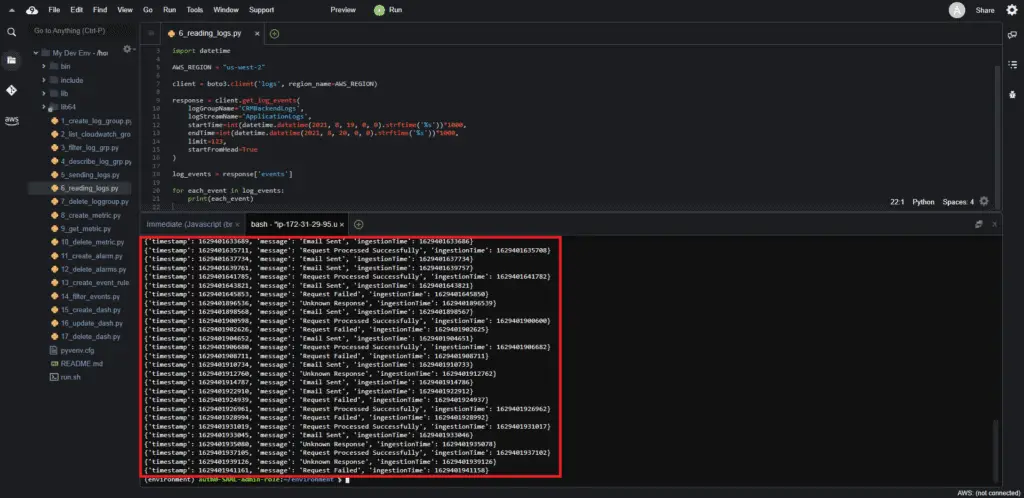
print(each_event)Here, we have defined the limit to be 123. Hence the script will emit 123 lines or below, starting from the beginning.
The output for this execution is:
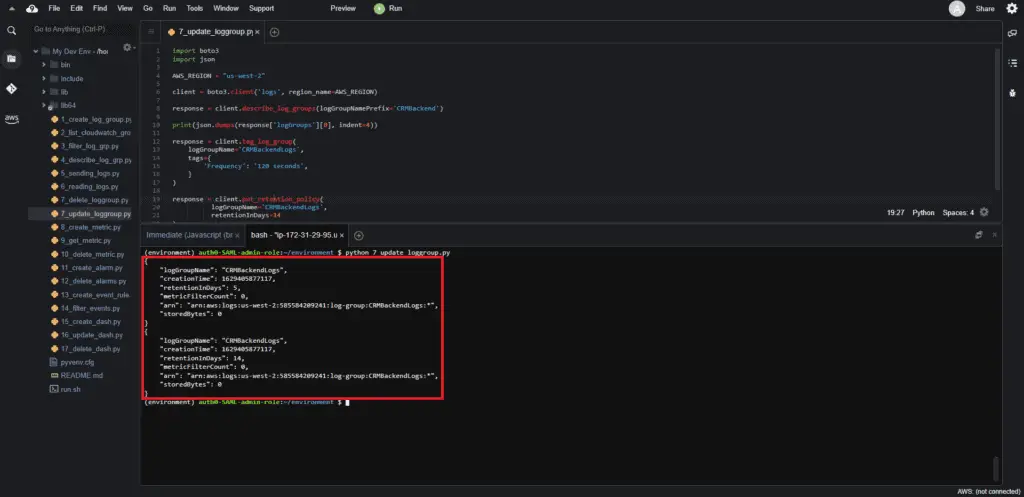
Updating CloudWatch log group
There are two attributes of the CloudWatch log group which you can update: tags and the retention policy. You can modify these attributes using the following CloudWatch Logs client methods: tag_log_group() and put_retention_policy().
Here’s an example of using those functions:
import boto3
import json
AWS_REGION = "us-west-2"
client = boto3.client('logs', region_name=AWS_REGION)
response = client.describe_log_groups(logGroupNamePrefix='CRMBackend')
print(json.dumps(response['logGroups'][0], indent=4))
response = client.tag_log_group(
    logGroupName='CRMBackendLogs',
    tags={
        'Frequency': '120 seconds',
    }
)
response = client.put_retention_policy(
          logGroupName='CRMBackendLogs',
          retentionInDays=14
)
response = client.describe_log_groups(logGroupNamePrefix='CRMBackend')
print(json.dumps(response['logGroups'][0], indent=4))
This generates the following output:
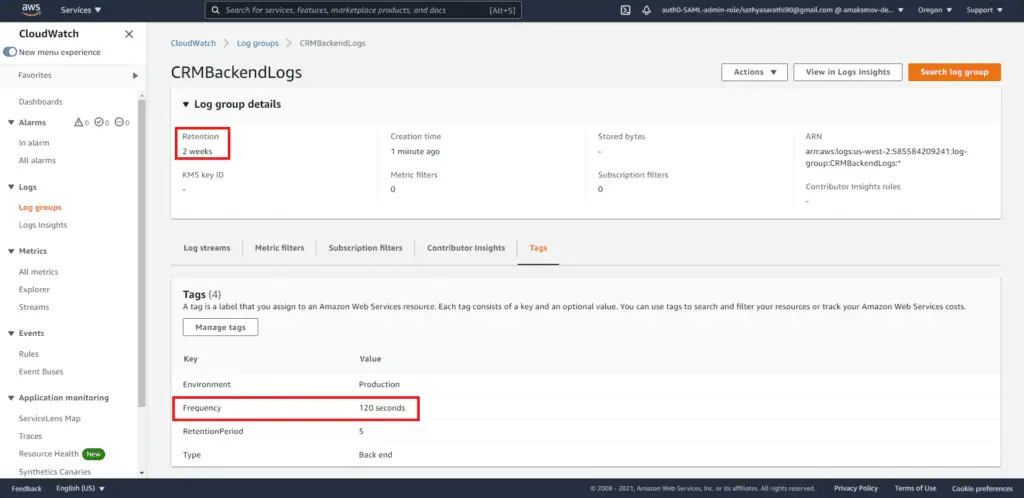
The tag update from the CloudWatch console:
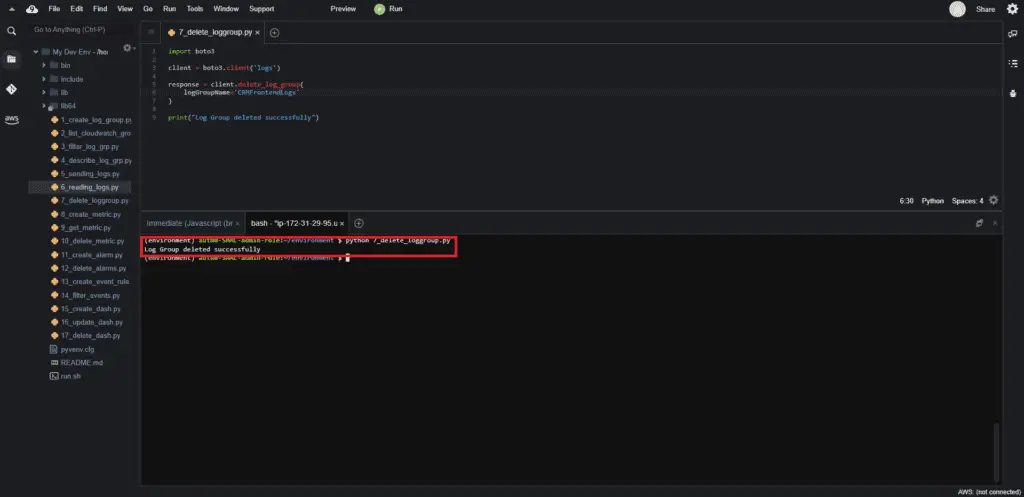
Deleting CloudWatch log group
You can delete the created CloudWatch log group by invoking the delete_log_group() method:
import boto3
AWS_REGION = "us-west-2"
client = boto3.client('logs', region_name=AWS_REGION)
response = client.delete_log_group(
    logGroupName='CRMFrontendLogs'
)
print("Log Group deleted successfully")
This will purge the log groups resulting in the following output:
Working with CloudWatch metrics using Boto3
CloudWatch metrics represent data about your system’s resources and applications’ performance. CloudWatch service allows you to store and analyze metrics to get valuable insights about your applications, systems, and business processes. And the Boto3 library contains everything you need to achieve this goal.
It all starts with the initialization of the CloudWatch client:
import boto3
AWS_REGION = "us-west-2"
cw_client = boto3.client('cloudwatch', region_name=AWS_REGION)
Alternatively, you can use the Boto3 CloudWatch resource, which provides you with an object-oriented way to access CloudWatch Metrics and CloudWatch alarms:
import boto3
AWS_REGION = "us-west-2"
cw_resource = boto3.resource('cloudwatch', region_name=AWS_REGION)
Sending metrics to CloudWatch
To send metrics to CloudWatch, you must use theput_metric_data() method of the CloudWatch client.
For example, let’s create a sample metric to track the number of visitors to a web page. Here, the device type and the web page are dimensions to calculate the metric. The dashboards contain the aggregated insights of CloudWatch.
Here’s how we generate the sample metric and publish them to CloudWatch:
import boto3
import random
AWS_REGION = "us-west-2"
client = boto3.client('cloudwatch', region_name=AWS_REGION)
for i in range(100):
response = client.put_metric_data(
Namespace='Web Metric',
MetricData=[
{
'MetricName': 'Number of visits',
'Dimensions': [
{
'Name': 'Device',
'Value': 'Android'
}, {
'Name': 'page',
'Value': 'index.html'
}
],
'Value': random.randint(10000, 100000),
'Unit': 'Count'
},
]
)
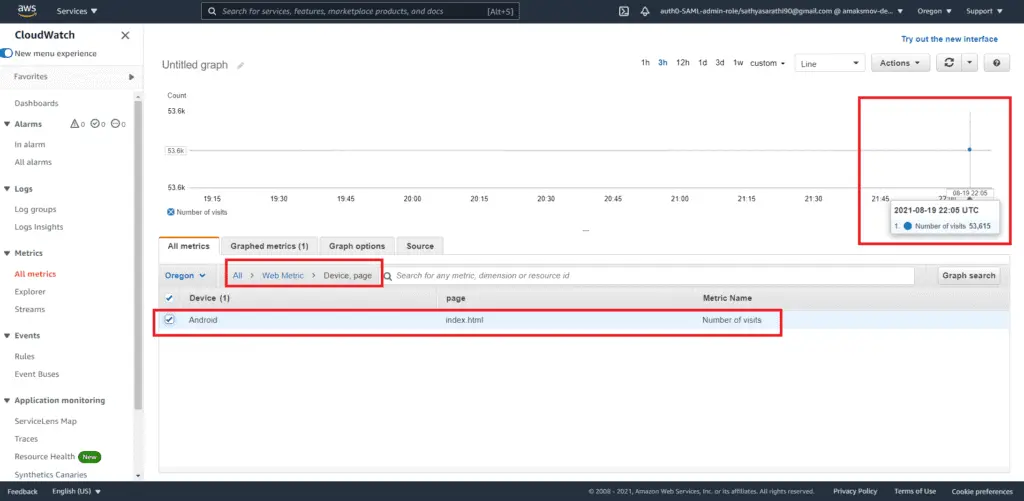
print(response)In the above code, we create a simple metric named Web Metric, which generates a random value corresponding to the device and page dimensions:
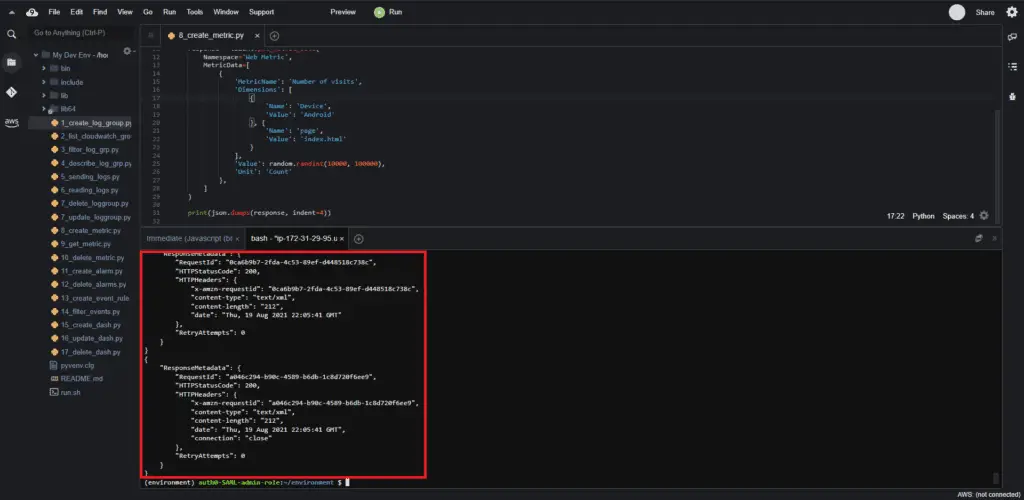
This will yield the following metrics:
Listing CloudWatch metrics
To list CloudWatch metrics, you need to use thelist_metrics() method of the CloudWatch client:
import boto3
AWS_REGION = "us-west-2"
client = boto3.client('cloudwatch', region_name=AWS_REGION)
response = client.list_metrics()

for each_metric in response['Metrics']:
    print(each_metric)
This generates the following output:
Filtering CloudWatch metrics
To filter CloudWatch metrics, you need to usethelist_metrics() method of the CloudWatch client. This method allows you to use the Namespace argument to filter metrics by the namespace.
import boto3
AWS_REGION = "us-west-2"
client = boto3.client('cloudwatch', region_name=AWS_REGION)
response = client.list_metrics(
Namespace='AWS/Usage'
)
for each_metric in response['Metrics']:
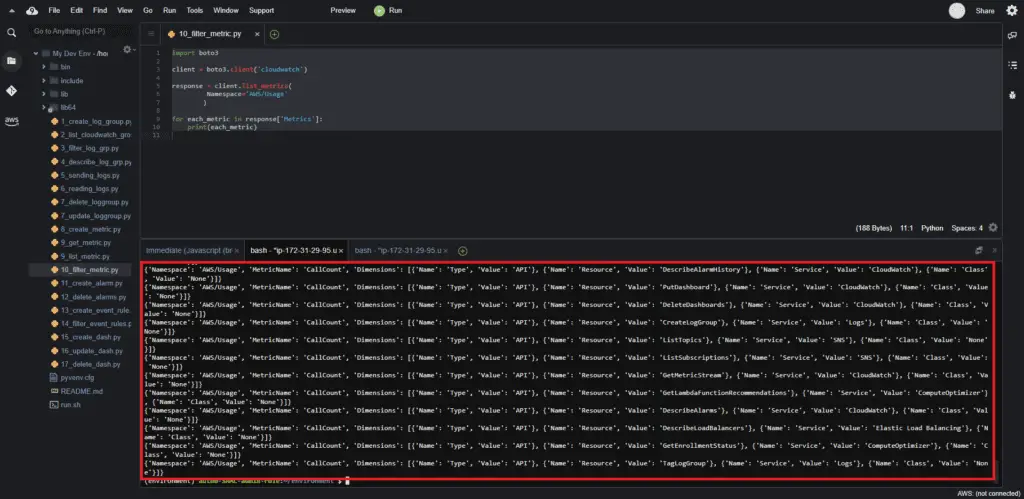
print(each_metric)
This results in output narrowed down to a specific namespace:
Getting CloudWatch metrics
To get CloudWatch metrics, you need to use the get_metric_data() method of the CloudWatch client. The arguments you need to provide are the query, start time, and end time. A list of queries presents in the MetricDataQueries.
import boto3
from datetime import datetime
AWS_REGION = "us-west-2"
client = boto3.client('cloudwatch', region_name=AWS_REGION)
response = client.get_metric_data(
MetricDataQueries=[
{
'Id': 'identifier',
'MetricStat': {
'Metric': {
'Namespace': 'Web Metric',
'MetricName': 'Number of visits',
'Dimensions': [
{
'Name': 'Device',
'Value': 'Android'
}, {
'Name': 'page',
'Value': 'index.html'
}
]
},
'Period': 300,
'Stat': 'Sum',
'Unit': 'Count'
}
},
],
StartTime=datetime(2021, 8, 17),
EndTime=datetime(2021, 8, 19)
)
print(response)
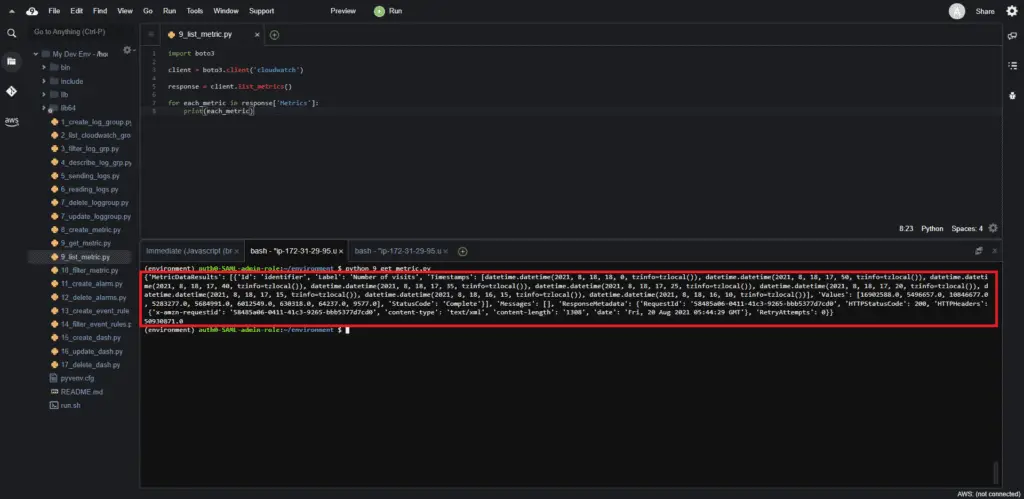
print(sum(response['MetricDataResults'][0]['Values']))
The code generates a series of CloudWatch metrics as:
Deleting CloudWatch metric using Boto3
You can’t delete the CloudWatch metrics through Web UI or Boto3.
Working with CloudWatch alarms using Boto3
You can define meaningful alarms to monitor the resources or applications based on CloudWatch metrics. Boto3’s cloudwatch client contains all required methods to work with CloudWatch alarms.
Creating CloudWatch alarm
To create a CloudWatch alarm, you need to use the put_metric_alarm() method of the CloudWatch client.
The following code creates an alarm for the previously generated CloudWatch metric:
import boto3
AWS_REGION = "us-west-2"
client = boto3.client('cloudwatch', region_name=AWS_REGION)
# Create alarm
cloudwatch.put_metric_alarm(
    AlarmName='Web_Traffic_Threshold',
    ComparisonOperator='GreaterThanThreshold',
    EvaluationPeriods=1,
    MetricName='Number of visits',
    Namespace='Web Metric',
    Period=60,
    Statistic='Sum',
    Threshold=5000,
    ActionsEnabled=False,
    AlarmDescription='Web Traffic Monitoring',
    Dimensions=[
         {
            'Name': 'Device',
            'Value': 'Android'
         }, {
            'Name': 'page',
            'Value': 'index.html'
         }
    ]
)
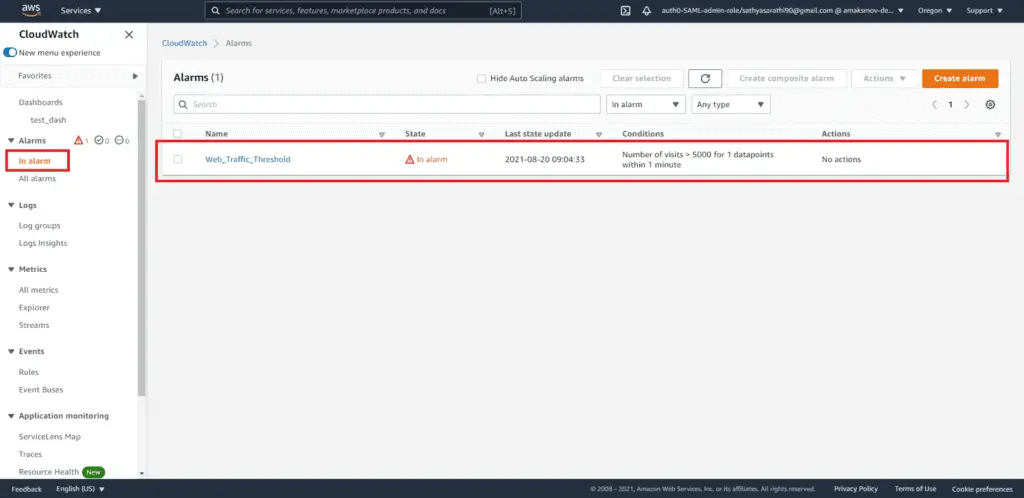
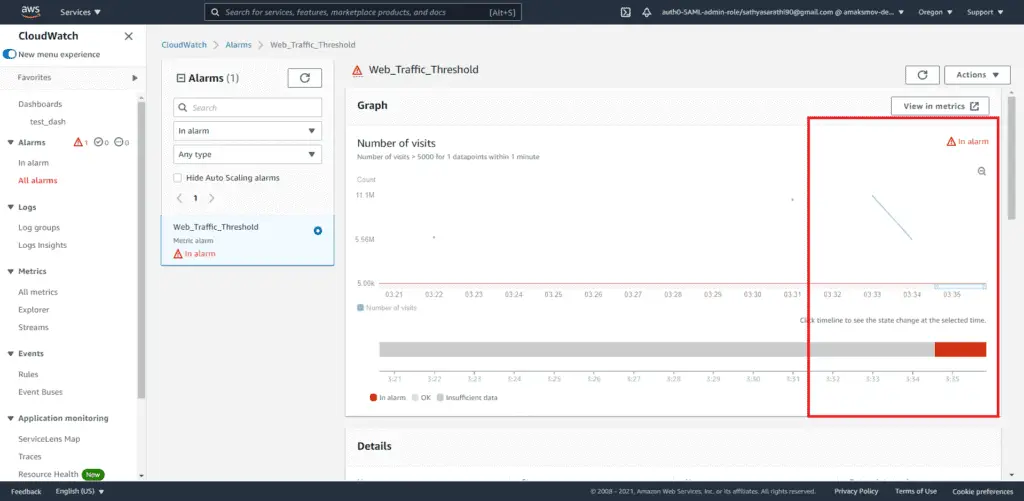
When the threshold for the number of visits for dimensions crosses 5000, the alarm goes on:
Updating CloudWatch alarm
To update a CloudWatch alarm, you must use the put_metric_alarm() method. A new call of this function with the new values will redefine an alarm if it already exists.
In the current scenario, we are modifying the alarm threshold from 5000 to 6000.
import boto3
AWS_REGION = "us-west-2"
client = boto3.client('cloudwatch', region_name=AWS_REGION)
# Create alarm
cloudwatch.put_metric_alarm(
    AlarmName='Web_Traffic_Threshold',
    ComparisonOperator='GreaterThanThreshold',
    EvaluationPeriods=1,
    MetricName='Number of visits',
    Namespace='Web Metric',
    Period=60,
    Statistic='Sum',
    Threshold=6000,
    ActionsEnabled=False,
    AlarmDescription='Web Traffic Monitoring',
    Dimensions=[
         {
            'Name': 'Device',
            'Value': 'Android'
         }, {
            'Name': 'page',
            'Value': 'index.html'
         }
    ]
)
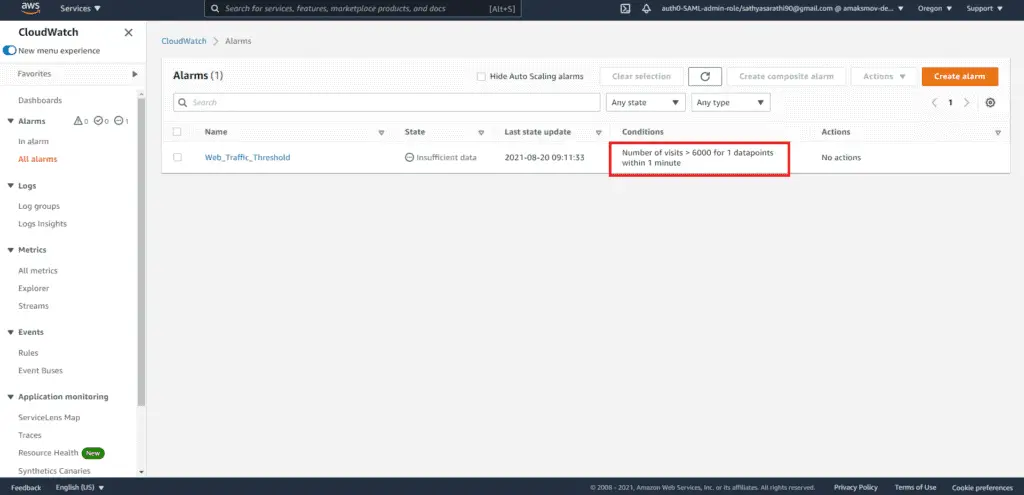
Upon executing this will update the CloudWatch alarm as shown below:
Deleting CloudWatch alarm
You can delete CloudWatch alarms using the delete_alarms() method of the CloudWatch client. You can pass in multiple alarm names as a list argument and delete those alarms within the same API call.
The code example is shown below:
import boto3
AWS_REGION = "us-west-2"
client = boto3.client('cloudwatch', region_name=AWS_REGION)
response = cloudwatch.delete_alarms(
    AlarmNames=[
        'Web_Traffic_Threshold',
    ]
)
print("Alarm deleted successfully")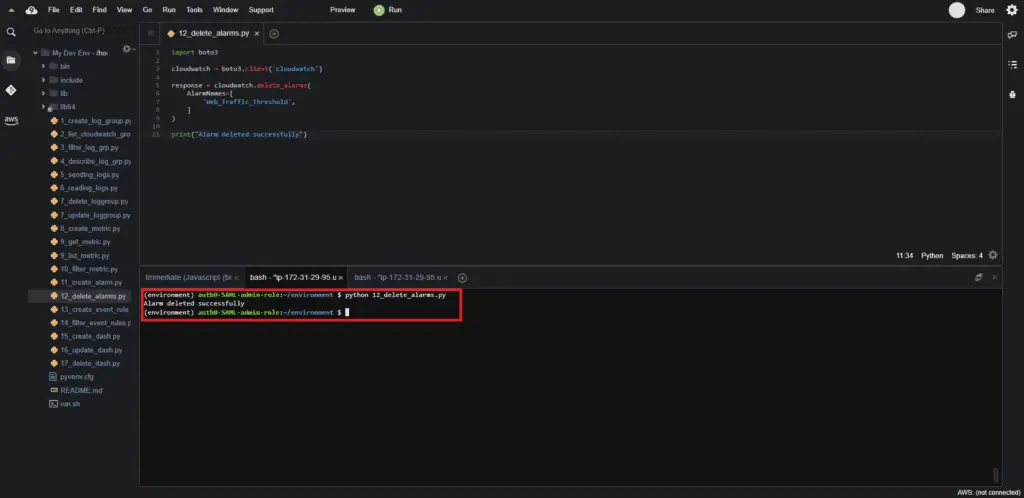
If the deletion doesn’t happen instantly, wait for a few minutes and try refreshing the Alarm page again.
Working with CloudWatch events using Boto3
CloudWatch Events (now known as Amazon EventBridge) creates rule-based triggers and schedules. In this section, we will create CloudWatch events based on the custom metrics we’ve created.
Creating CloudWatch event rule
You can create the EventBridge (CloudWatch) event rule by using the put_rule() method of the EventBridge client. This method takes the EventPattern argument to define which source to watch out for. Depending on the use case, the user selects the source and detail type for the rule.
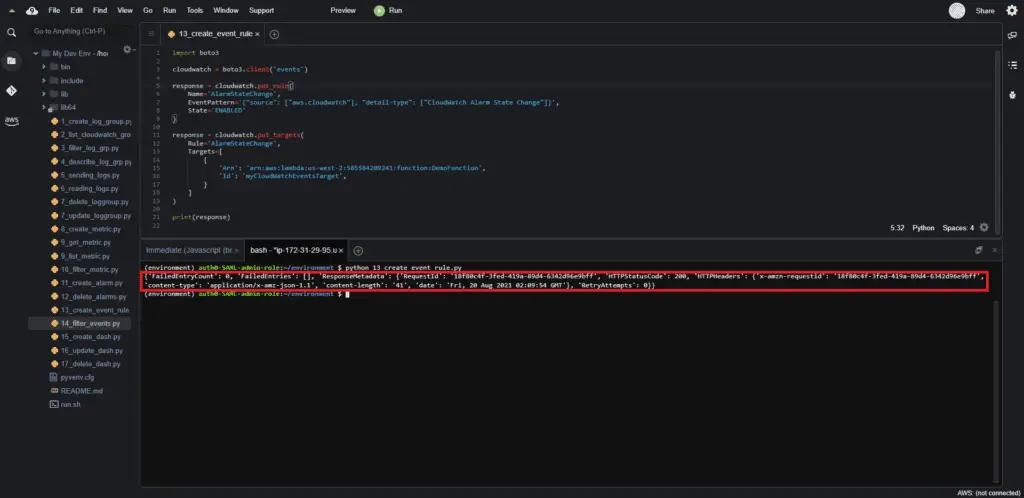
In the following scenario, we’ll monitor the alarm state change in CloudWatch and invoke a Lambda function in case of the event:
import boto3
AWS_REGION = "us-west-2"
client = boto3.client('events', region_name=AWS_REGION)
response = cloudwatch.put_rule(
Name='AlarmStateChange',
EventPattern='{"source": ["aws.cloudwatch"], "detail-type": ["CloudWatch Alarm State Change"]}',
State='ENABLED'
)
response = cloudwatch.put_targets(
Rule='AlarmStateChange',
Targets=[
{
'Arn': 'arn:aws:lambda:us-west-2:585584209241:function:DemoFunction',
'Id': 'myCloudWatchEventsTarget',
}
]
)
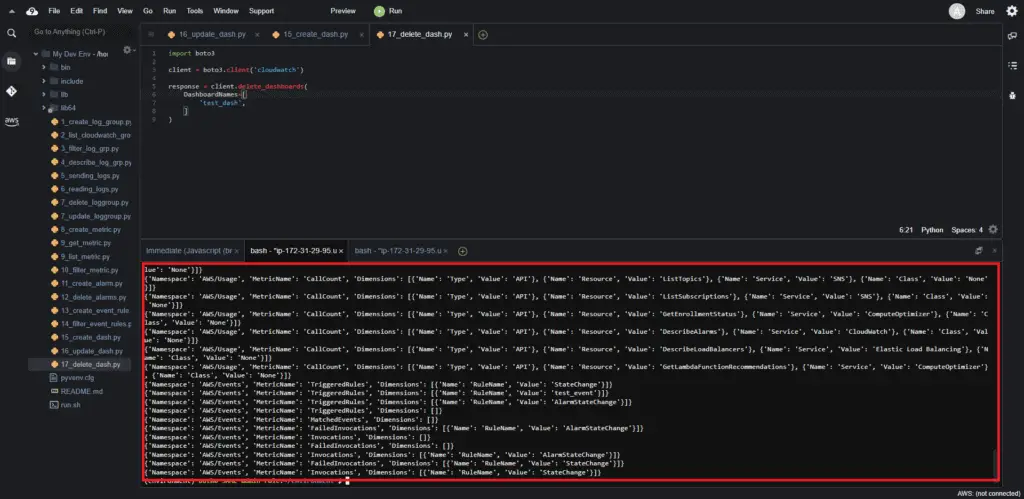
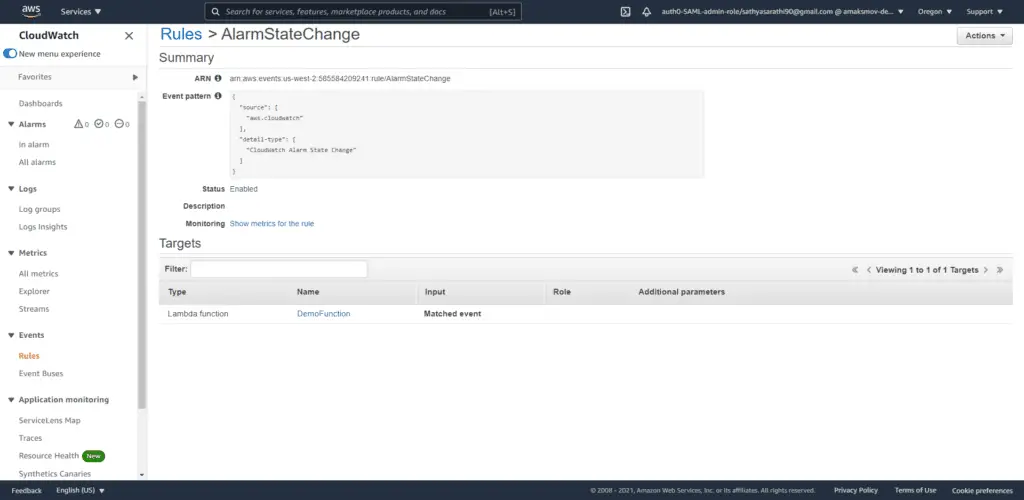
print(response)The above code generates the rule and the target in the output shown below:
Filtering CloudWatch event rules
You can filter EventBridge rules based on their prefixes by calling the list_rules() method if the EventBridge client. This can help narrow down to specific rules and filter common name holders.
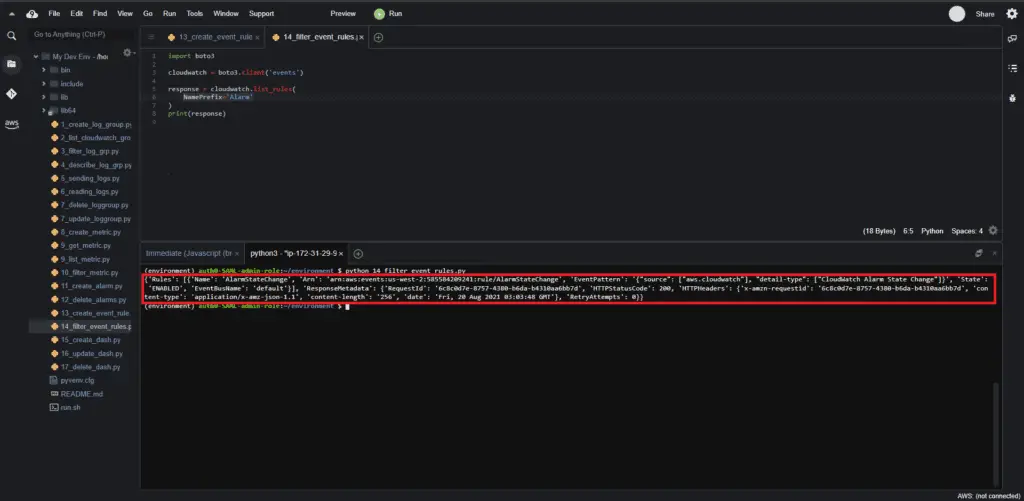
In the following example, we’re filtering rules based on the NamePrefix:
import boto3
AWS_REGION = "us-west-2"
client = boto3.client('events', region_name=AWS_REGION)
response = cloudwatch.list_rules(
    NamePrefix='Alarm'
)
print(response)
Here’s an execution output:
Working with CloudWatch dashboards using Boto3
Now, we have the logs, metrics, and alarms in place. And we can create a CloudWatch dashboard to help monitor all our resources.
Boto3 provides functions to dynamically create, update and delete these dashboards in an automated way.
Creating CloudWatch dashboard
To create aCloudWatch dashboard, you need to use theput_dashboard() method of the CloudWatch client.
Two arguments define the dashboard: DashboardName and DashboardBody.
The DashboardBody contains multiple widgets. Each widget has its own set of characteristics, such as the dimensions, the location, the type of visualization, and the region where these metrics are present.
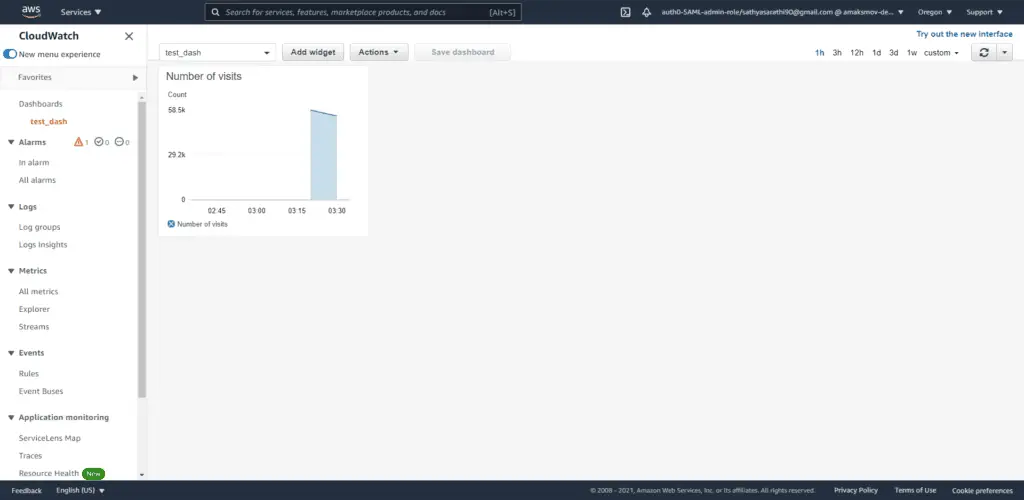
In the following example, we’ll create a stacked time series widget to visualize the Web Metric that we had created earlier:
import boto3
AWS_REGION = "us-west-2"
client = boto3.client('cloudwatch', region_name=AWS_REGION)
dash_body = """
{
    "widgets": [
        {
            "type": "metric",
            "x": 0,
            "y": 0,
            "width": 6,
            "height": 6,
            "properties": {
                "view": "timeSeries",
                "stacked": true,
                "metrics": [
                    [ "Web Metric", "Number of visits",
                        "Device", "Android", "page", "index.html" ]
                ],
                "region": "us-west-2",
                "title": "Number of visits"
            }
        }
    ]
}
"""
response = client.put_dashboard(
    DashboardName='test_dash',
    DashboardBody=dash_body
)
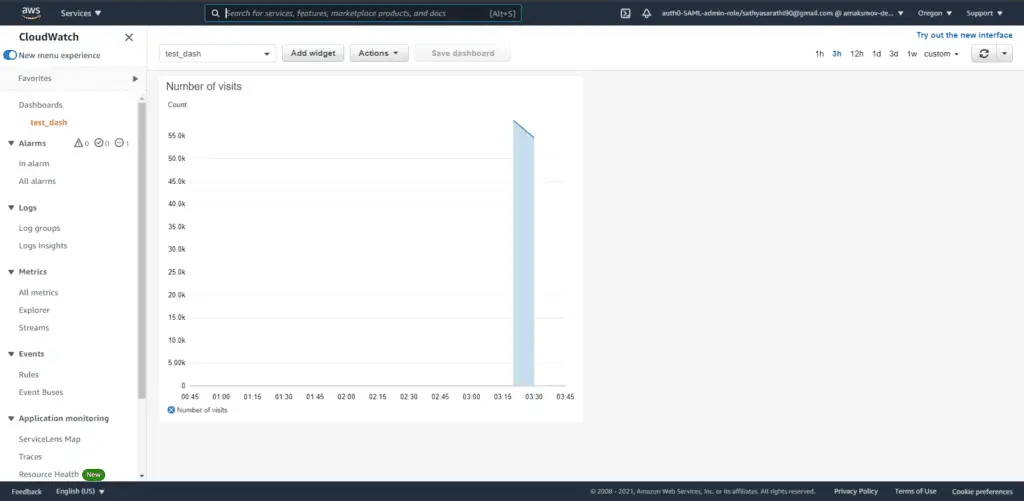
The code above will create the following dashboard embedded with the widget. The data point will take less than a minute to appear on the widget.
Updating CloudWatch dashboard
To update the CloudWatch dashboard, you need to usetheput_dashboard() method of the CloudWatch client. This method can update the existing dashboard widgets if it already exists.
In the following example, we’ll increase the widget’s dimensions to a larger number using the same function call mentioned in the previous section.
import boto3
AWS_REGION = "us-west-2"
client = boto3.client('cloudwatch', region_name=AWS_REGION)
dash_body = """
{
    "widgets": [
        {
            "type": "metric",
            "x": 0,
            "y": 0,
            "width": 12,
            "height": 12,
            "properties": {
                "view": "timeSeries",
                "stacked": true,
                "metrics": [
                    [ "Web Metric", "Number of visits", "Device", "Android", "page", "index.html" ]
                ],
                "region": "us-west-2",
                "title": "Number of visits"
            }
        }
    ]
}
"""
response = client.put_dashboard(
    DashboardName='test_dash',
    DashboardBody=dash_body
)
This expands the size of the widget compared to the previous section:
Deleting CloudWatch dashboard
To delete aCloudWatch dashboard, you need to use the delete_dashboards() method of the CloudWatch client.
You can provide names of dashboards in the form of the Python list:
import boto3
AWS_REGION = "us-west-2"
client = boto3.client('cloudwatch', region_name=AWS_REGION)
response = client.delete_dashboards(
    DashboardNames=[
        'test_dash',
    ]
)
Summary
This article has covered examples of using Boto3 for writing, exploring, monitoring, and managing logs, metrics, and events in AWS CloudWatch. We’ve also looked at creative ways to bring out valuable visualizations using CloudWatch dashboards.
