Implementation of ECLAT algorithm using Python
The ECLAT (Equivalence Class Clustering and bottom-up Lattice Traversal) algorithm is a data mining algorithm for association rule mining designed to solve customer bucket analysis problems. The goal is to understand which products from the bucket are commonly bought together. This article will describe the ECAT algorithm implementation and association rules generation using Python, Jupyter Notebook, and Amazon SageMaker.
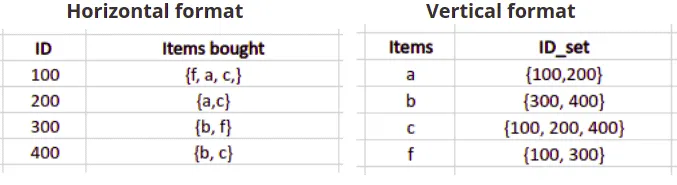
There are two ways to organize data in relational databases:
- Row-oriented – the traditional way of storing data that stores data records in rows and splits it by one or several columns
- Column-oriented (also known as columnar or C-store) – stores data by field, keeping all of the data associated with a field next to each other
Check out the Row vs. Column Oriented Databases article for more information on the topic.
The Apriori and FP-growth algorithms require data to be in the row format (sometimes called “horizontal format” in other blogs on the internet). In contrast, the ECLAT algorithm is designed to deal with the data stored in the column-oriented format (sometimes called “vertical format”).
Here’s an example of transactions datasets stored in both formats:
Overview of the ECLAT algorithm
ECLAT (Equivalence Class Clustering and bottom-up Lattice Traversal) algorithm is a data mining algorithm for association rule mining while solving customer’s basket analysis problem: the goal is to understand which products are often bought together. The ECLAT algorithm can’t be applied to the data represented in horizontal format, and you have to convert it into the vertical format before using it.
This vertical approach of the ECLAT algorithm makes it faster than the Apriori and FP-growth algorithms as it scans the database only once. The Apriori algorithm scans the database every single iteration, and the FP-growth algorithm does it two times two times.
Now, we can take sample data and review the ECLAT algorithm steps.
Let’s assume that we have the following database, and we set up the minimum support value (minimum number of item occurrences in the transactions list) to 2.
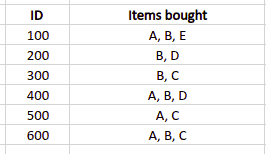
As we can see, the data is in horizontal format. So, we need to transform it:
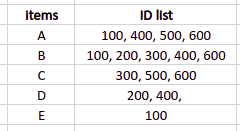
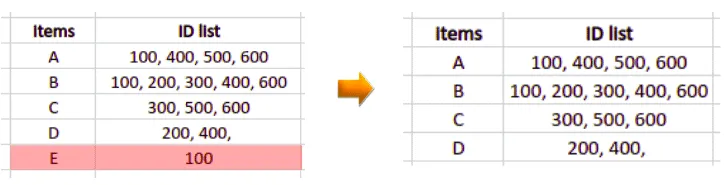
As our minimum support value is 2, all items that appeared in only one transaction will be excluded from the dataset.
The next step is to create a list containing different sets of items’ combinations with the total set length equal to 2.
All possible combinations are the following:
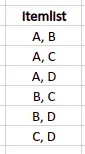
Now, we need to associate all item combinations with corresponding transaction IDs. In our example, we’ll get the following table:
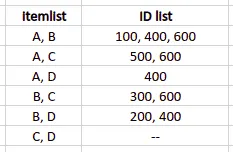
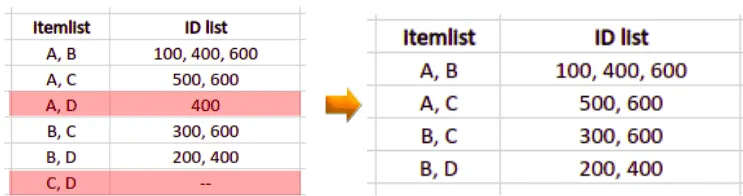
We need to remove items combinations having support value less than the minimum support:
We repeat these steps as many times as needed to analyze itemsets of the required length. In our current example, when we create the product pairs of three products, we can find that only one group of items appeared in a single transaction.
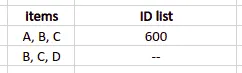
But one transaction is less than the minimum support value (two transactions), so we will generate association rules based on the previous step output.
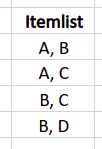
Here’s the recommended items list generated by the ECLAT algorithm based on our conditions and dataset:
Implementation of ECLAT using Python
Let’s implement the ECLAT algorithm using Python. We will use the pyECLAT module to implement the ECLAT algorithm. You can install the pyECLAT by running the following command in the cell of your Jupyter notebook:
%pip install pyECLAT
%pip install numpy
%pip install pandas
%pip install plotly
Importing and exploring the dataset
We will use the built-in dataset available in the pyECLAT module. Let us first import the pyECLAT module and the build-in dataset.
# importing dataset ( example 1 and example 2 are datasets in pyECLAT)
from pyECLAT import Example2
# storing the dataset in a variable
dataset = Example2().get()
# printing the dataset
dataset.head()
Output:
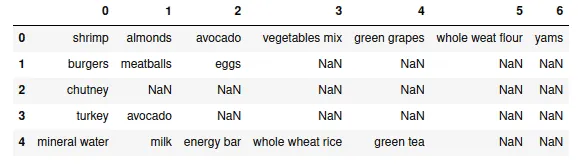
Each row represents a customer’s purchase at a supermarket in this dataset. For example, in row 1, the customer purchased only burgers, meatballs, and eggs.
Let’s get more information about the dataset by printing more details.
# printing the info
dataset.info()
Output:
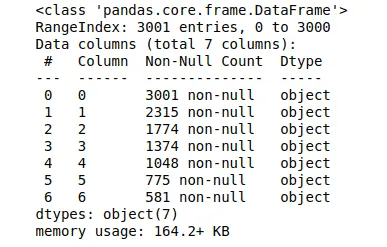
The output shows that the dataset contains 3001 rows and 7 columns.
Visualizing the frequent items
To visualize the frequent items, let’s load the dataset to the ECLAT class and generate binary DataFrame:
# importing the ECLAT module
from pyECLAT import ECLAT
# loading transactions DataFrame to ECLAT class
eclat = ECLAT(data=dataset)
# DataFrame of binary values
eclat.df_bin
Output:
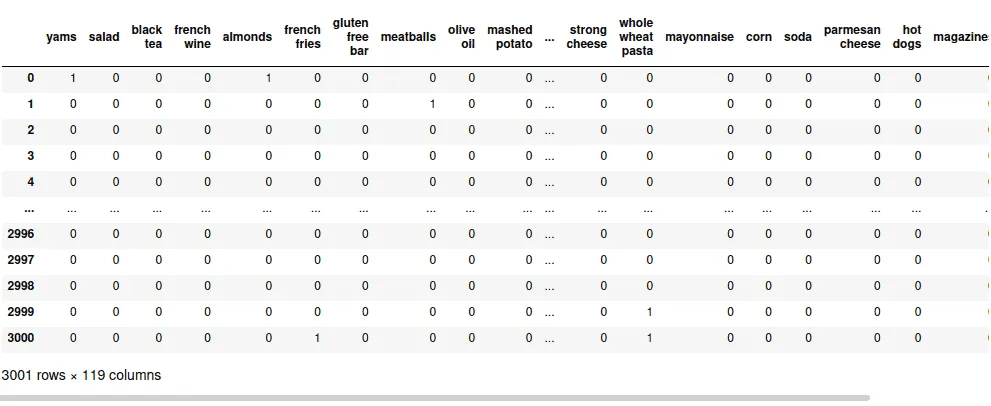
In this binary dataset, every row represents a transaction. Columns are possible products that might appear in every transaction. Every cell contains one of two possible values:
- 0 – the product was not included in the transaction
- 1 – the transaction contains the product
Now, we need to count items for every column in the DataFrame:
# count items in each column
items_total = eclat.df_bin.astype(int).sum(axis=0)
items_total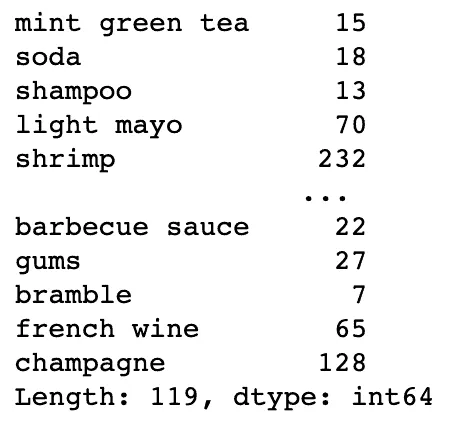
And it would be helpful to get the count of the items for every row in the DataFrame:
# count items in each row
items_per_transaction = eclat.df_bin.astype(int).sum(axis=1)
items_per_transaction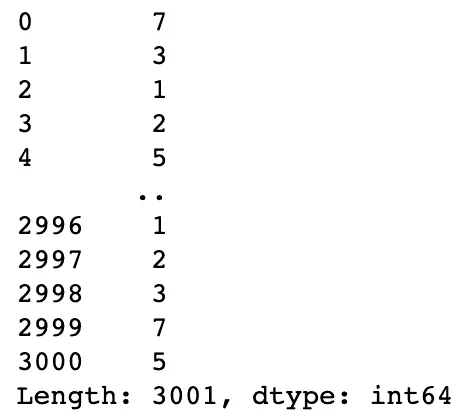
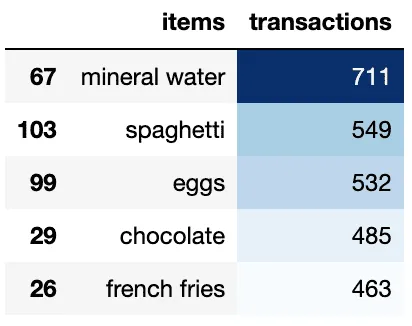
Now, we can use these Series to visualize items distribution:
import pandas as pd
# Loading items per column stats to the DataFrame
df = pd.DataFrame({'items': items_total.index, 'transactions': items_total.values})
# cloning pandas DataFrame for visualization purpose
df_table = df.sort_values("transactions", ascending=False)
#  Top 5 most popular products/items
df_table.head(5).style.background_gradient(cmap='Blues')
Output:
We can also visualize the frequently occurring items using TreeMap:
# importing required module
import plotly.express as px
# to have a same origin
df_table["all"] = "Tree Map"
# creating tree map using plotly
fig = px.treemap(df_table.head(50), path=['all', "items"], values='transactions',
                  color=df_table["transactions"].head(50), hover_data=['items'],
                  color_continuous_scale='Blues',
                )
# ploting the treemap
fig.show()
Output:
Generating association rules
To generate association rules, we need to define:
- Minimum support – should be provided as a percentage of the overall items from the dataset
- Minumum combinations – the minimum amount of items in the transaction
- Maximum combinations – the minimum amount of items in the transaction
Note: the higher the value of the maximum combinations the longer the calculation will take.
# the item shoud appear at least at 5% of transactions
min_support = 5/100
# start from transactions containing at least 2 items
min_combination = 2
# up to maximum items per transaction
max_combination = max(items_per_transaction)
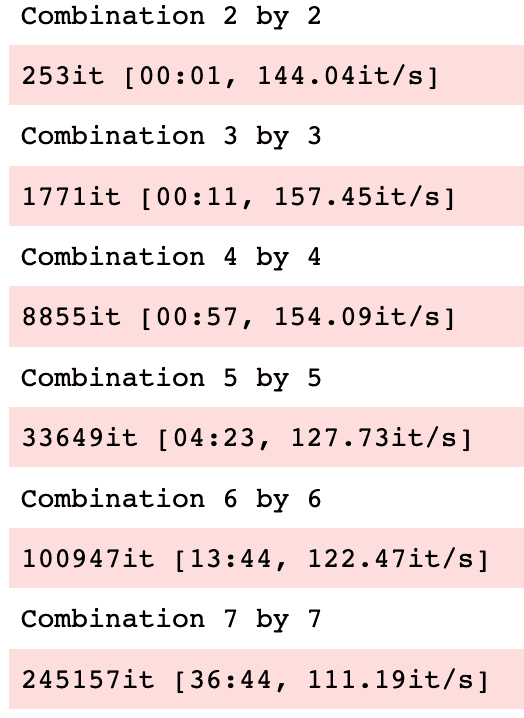
rule_indices, rule_supports = eclat.fit(min_support=min_support,
min_combination=min_combination,
max_combination=max_combination,
separator=' & ',
verbose=True)Output:
The fit() method of the ECLAT class returns:
- association rule indices
- association rule support values
We’re interested only in association rule support values (the rule_supports dictionary):
import pandas as pd
result = pd.DataFrame(rule_supports.items(),columns=['Item', 'Support'])
result.sort_values(by=['Support'], ascending=False)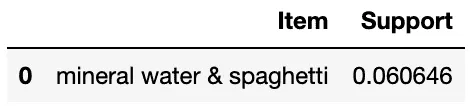
We found that mineral water and spaghetti are commonly purchased by customers based on the transaction data in our dataset and the minimum support value we’ve provided.
Summary
Apriori, FP-tree, and ECLAT are the most famous association rules-generating algorithms. This article covers the ECAT algorithm implementation and association rules generation using Python, Jupyter Notebook, and Amazon SageMaker.
