Pytrends – Simple way to work with Google Trends APIs
Google Trends is a public platform that you can use to analyze the popularity of top search queries in Google Search across various regions and languages and interest to search queries over time for a given topic, search term, and even company. If you’d like to build your custom reports or analyze search terms, you need to use Pytrends – an unofficial Google Trends API that provides different methods to download reports of trending results from Google Trends. In this article, we will share some insight on what you can do with this Google Trends API and how to use Google Trends API using Python.
Table of contents
What data can I get from Google Trends?
You can use the Google Trends web page or Pytrends library to get the following information from the service:
- Interest Over Time
- Historical Hourly Interest
- Interest by Region
- Related Topics
- Related Queries
- Trending Searches
- Top Charts
- Google keyword suggestions
We’ll show below how to use the Pytrends library to get all mentioned examples.
How to interpret Google Trends data?
Google Trends normalizes search data to make comparisons between terms easier. Search results are normalized to the time and location:
- Relative popularity: each data point is divided by the total searches of the geography and time range it represents
- Single scale: the relative popularity values are scaled on a range of 0 to 100 based on a topic’s proportion to all searches on all topics
- Abstract search volume: different regions that show the same search interest for a term don’t always have the same total search volumes
In summary, it makes sense to compare search terms only during the same period of time and geolocation.
Google Trends Benefits
- The latest trends: Google Trends contains various information about the latest search trends for any country. This information can be very useful for advertisers to create content and frame the strategies as hot topics. Almost every business runs after the trend to get more clients and customers. Google tends tool will help you get insight into the most trending news and information across the countries.
- Analyze the area and location of high interest: Google Trend allows you to watch the location and region involved and interested in your web search keywords. This can help the user to mold their content according to the people of that specific location and enhance customer engagement.
- Analyze Competitor: Analyzing and monitoring your competitor’s actions can be a good step towards the progress of your business or brand. One of the Google trends tools shows your competitor in the market. Although this is not the very deepest analyzer still provides you with some of the best competitors regarding your searched keyword.
- An additional source of keywords: every content creator is willing to increase the traffic to his website. With the help of Google Trends, you can find your content’s top and trending keywords.
Google Trends Limitations
- Search terms and related topics: searched terms and related topics are two different things, and the related topics sometimes don’t work at the place of related searched keywords
- Keyword length limitations: Google returns a result of 4XX error code when a keyword is greater than 100 characters
- The data is relative, not exact: Google Trends shows the relative normalized data, and you can not use its data to estimate the exact amount of searches
- Only five entries are allowed: you can query only five topics at a time, and you need to join your Pandas DataFrames if you need to analyze more keywords
Getting Google Trends data using Pytrends
This article section will use Pytrends to extract meaningful information about search term queries. We’ll be using Jupyter Notebook for implementation and visualization purposes.
If you’re interested in building your own Docker container with all required libraries, check out our article “How to build Anaconda Python Data Science Docker container“.
Python dependencies
For demo purposes, we’ll need to install the following dependencies:
- pytrends – an unofficial Python API for Google Trends
- pandas – a fast, powerful, flexible, and easy-to-use open-source data analysis and manipulation tool
- plotly – a data analytics and visualization library
- country-converter – a Python package to convert and match country names between different classifications
To install the required Python modules, you need to execute the following commands in the Jupyter Notebook cell:
%pip install pytrends
%pip install pandas
%pip install plotly
%pip install country-converter
Configuring connection
Now can import the required packages and initialize TrendReq class, which specifies parameters for connecting to Google Trends API, including proxy configuration, timezone offset, retries, etc. For more information, check out the official PyTrends documentation. We’ll use the default settings:
import pytrends
from pytrends.request import TrendReq
import pandas as pd
# Configuring connection
pytrend = TrendReq()
Common configuration parameters
All Pytrends methods use common parameters for making requests to Google Trends API:
kw_list– list of keywords to query the information aboutcat– Google category for narrowing resultsgeo– geolocation of keywords searches (default isWorld, useUSto filter for the United States)tz– timezone offset (might be important when you’re looking for trending queries within a short timeframe)timeframe– specifies the timeframe for getting search information. The most commonly used values are:all– entire available time rangetoday 5-y– five years from nowtoday #-m–#number of months from now (#might be equal to 1, 3, and 12), for example,today 3-m– three months from nownow #-d–#number of days from now (#might be equal to 1 and 7), for example,today 1-d– one day from nownow #-h–#number of hours from now (#might be equal to 1 and 4), for example,today 1-h– one hour from now2022-01-01 2022-02-01– specific date range
gprop– allows filtering results by Google property. You can useimages,news,youtubeorfroogle(for Google Shopping results) as a value here
Let’s choose several keywords (up to five) and set up a common configuration:
# list of keywords we're interested in (max 5)
kw_list = ['aws ec2', 'aws s3', 'aws vpc', 'aws iam', 'aws lambda']
# Building payload
pytrend.build_payload(kw_list=kw_list, timeframe='today 12-m')
We’ll search for information about required keywords within the last 12 months in the example above.
Interest over time
To get historical data for the keyword indexed by the search date, you need to use the interest_over_time() method of the TrendReq class. The method returns pandas.Dataframe that contains the information shown in the “Interest Over Time” section of the Google Trends website.
interest_over_time_df = pytrend.interest_over_time().drop(columns='isPartial')
interest_over_time_df.head()
We don’t need isPartial column in the dataset, that’s why we’re using the drop() method of the pandas.DataFrame at the end.

Now, we can plot the simplest line chart describing the popularity or search volume for specified queries around the globe:
pd.options.plotting.backend = "plotly"
fig = interest_over_time_df[kw_list].plot()
fig.update_layout(
    title_text='Search volume over time',
    legend_title_text='Search terms'
)
fig.show()
Let’s use a bar chart to visualize a slice of our data for the specific date range:
import plotly.graph_objects as go
start_time = '2022-01-01'
end_time = '2022-02-01'
df = interest_over_time_df.loc[
    (interest_over_time_df.index >= start_time) & (interest_over_time_df.index < end_time)
]
fig = go.Figure()
for kw in kw_list:
    fig.add_trace(go.Bar(
        x=df.index.astype(str),
        y=df[kw],
        name=kw
    ))
fig.update_layout(
    barmode='group',
    xaxis_tickangle=-45,
    title_text=f'Search volume between {start_time} and {end_time}',
    legend_title_text='Search terms'
)
fig.show()
Search by geographical region
The Pytrends library allows you to query the search volume information split by geographical region for specified search terms. You need to use the interest_by_region() method of the TrendReq class to achieve this goal:
# resolution can be either CITY, COUNTRY or REGION
interest_by_region_df = pytrend.interest_by_region(resolution='COUNTRY')
interest_by_region_df.reset_index(inplace=True)
The resolution value is dependent on the geo parameter of the common configuration:
- Use
resolution='COUNTRY'forgeo='World' - Use
resolution='REGION'forgeo='US', for example
To plot the following chart, we’ll sort the data by the ‘aws s3’ search term as soon as it has the highest volume and limit the dataset to 20 records only:
df = interest_by_region_df.sort_values('aws s3', ascending=False).head(20)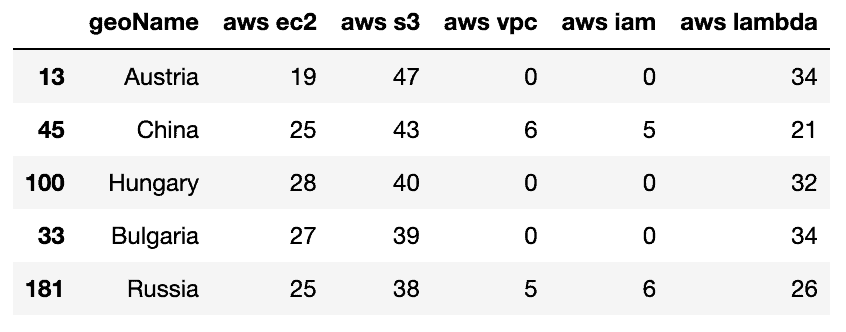
Let’s plot the chart:
import plotly.express as px
fig = px.bar(df, x='geoName', y=kw_list)
fig.update_layout(
    title_text=f'Search volumes by country',
    legend_title_text='Search terms'
)
fig.update_yaxes(title_text='Volume')
fig.update_xaxes(title_text='Country')
fig.show()
The chart above allows us to review search terms volumes quickly, but we suggest supplementing it with a geolocation or choropleth maps chart.
To build a choropleth map, we need three letters codes for every geolocation (geoName column), which we can get by using the country-converter module:
import country_converter as coco
df = df.assign(geoCode=lambda x: (coco.convert(x['geoName'])))
df.head()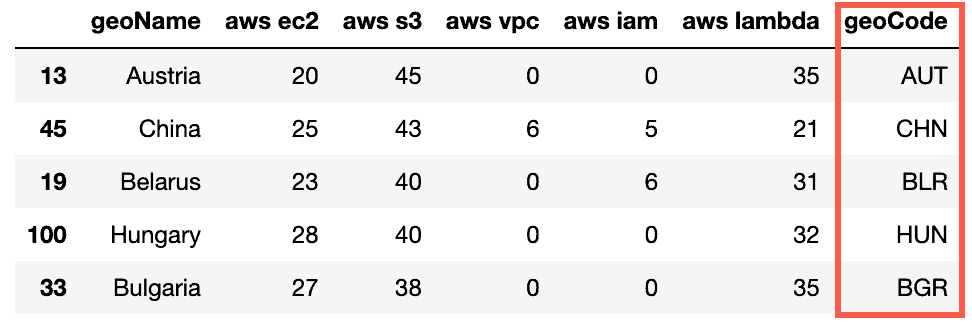
In addition, for every geolocation, we need to know which query has the highest search volume. Let’s create a couple of additional columns with this information:
# store search volume of the leading term
df['winnerValue'] = df[kw_list].max(axis = 1)
# store the leading search term name
df['winnerLabel'] = df[kw_list].idxmax(axis = 1)
# if geolocation has 0 volume for all terms
# we can safely remove these rows
df = df[df.winnerValue != 0]
df.head()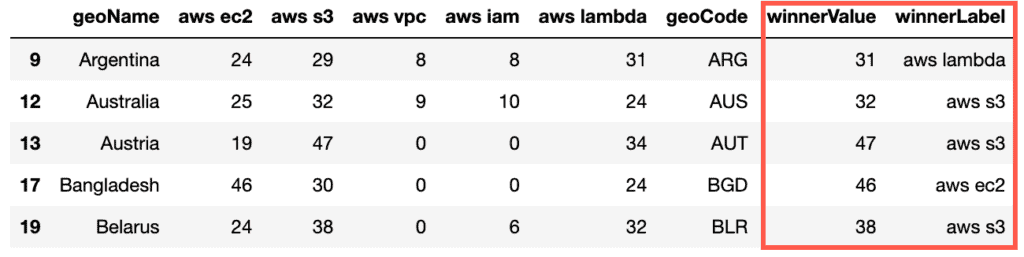
Now, we can use this dataset to build a “Compared breakdown by region” chart:
import country_converter as coco
df = interest_by_region_df.copy()
df = df.assign(geoCode=lambda x: (coco.convert(x['geoName'])))
df['winnerValue'] = df[kw_list].max(axis = 1)
df['winnerLabel'] = df[kw_list].idxmax(axis = 1)
df = df[df.winnerValue != 0]
cdm = dict(zip(kw_list, ['#699DF2','#DF8179','#00CD96','#AA62FA','#BB8AC3']))
fig = px.choropleth(
    df,
    locations='geoCode',
    color='winnerLabel',
    hover_name='geoName',
    color_discrete_map=cdm
)
fig.update_layout(
    title_text="Compared breakdown by region",
    legend_title_text='Trend value'
)
fig.show()
To plot the geo-distribution for the specific search term, you can use the following code snippet as an example:
import plotly.graph_objects as go
KEYWORD = 'aws s3'
df = interest_by_region_df.copy()
df = df.assign(geoCode=lambda x: (coco.convert(x['geoName'])))
fig = go.Figure(data=go.Choropleth(
    locations = df['geoCode'],
    z = df[KEYWORD],
    text = df['geoName'],
    colorscale = 'Blues',
    autocolorscale=False,
    reversescale=False,
    marker_line_color='darkgray',
    marker_line_width=0.5,
    colorbar_title = 'Search volume',
))
fig.update_layout(
    title_text=f'Searches of "{KEYWORD}" by region',
    geo=dict(
        showframe=False,
        showcoastlines=False,
        projection_type='equirectangular'
    )
)
fig.show()
Search within the country (US)
In this article section, we’ll show you how to search and visualize a search term for a specific country using the US as an example.
Here’s the query example where we’re using geo='US' common parameter to specify the country:
# building new payload for the API calls
pytrend.build_payload(kw_list, geo='US')
# requesting data
interest_by_region_df = pytrend.interest_by_region(resolution='COUNTRY', inc_low_vol=True)
# moving geoName from the index to the column
interest_by_region_df.reset_index(inplace=True)
# showing the DataFrame example
interest_by_region_df.head()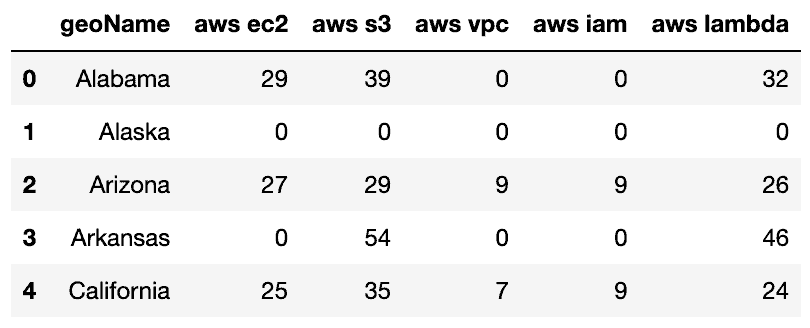
Again, the choropleth map chart requires two symbols of states’ codes. Let’s use a couple of dictionaries that will help us to make this transformation:
code_state = {"AL":"Alabama", "AK":"Alaska", "AZ":"Arizona", "AR":"Arkansas", "CA":"California", "CO":"Colorado",
              "CT":"Connecticut", "DC":"Washington DC", "DE":"Delaware", "FL":"Florida", "GA":"Georgia",
              "HI":"Hawaii", "ID":"Idaho", "IL":"Illinois", "IN":"Indiana", "IA":"Iowa", "KS":"Kansas",
              "KY":"Kentucky", "LA":"Louisiana", "ME":"Maine", "MD":"Maryland", "MA":"Massachusetts",
              "MI":"Michigan", "MN":"Minnesota", "MS":"Mississippi", "MO":"Missouri", "MT":"Montana",
              "NE":"Nebraska", "NV":"Nevada", "NH":"New Hampshire", "NJ":"New Jersey", "NM":"New Mexico",
              "NY":"New York", "NC":"North Carolina", "ND":"North Dakota", "OH":"Ohio", "OK":"Oklahoma",
              "OR":"Oregon", "PA":"Pennsylvania", "RI":"Rhode Island", "SC":"South Carolina", "SD":"South Dakota",
              "TN":"Tennessee", "TX":"Texas", "UT":"Utah", "VT":"Vermont", "VA":"Virginia", "WA":"Washington",
              "WV":"West Virginia","WI":"Wisconsin", "WY":"Wyoming"}
state_code = dict([(value, key) for key, value in code_state.items()])
Now we can add state short-codes to the DataFrame:
interest_by_region_df["state_code"] = interest_by_region_df.geoName.map(state_code)
interest_by_region_df.head()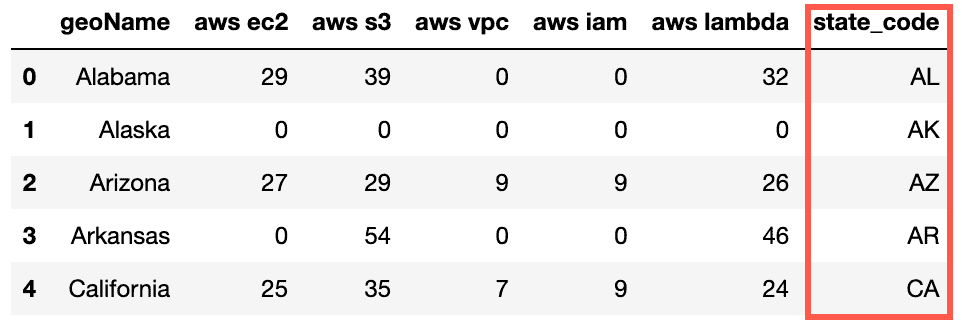
Finally, we can plot search query volume distribution on the US map:
import plotly.graph_objects as go
KEYWORD = 'aws s3'
fig = go.Figure(data=go.Choropleth(
    locations=interest_by_region_df['state_code'],
    z = interest_by_region_df[KEYWORD],
    locationmode = 'USA-states',
    colorscale = 'Blues',
    colorbar_title = "Trend value",
))
fig.update_layout(
    title_text=f'"{KEYWORD}" searches by state',
    geo_scope='usa',
)
fig.show()
Getting related queries
To get related raising search queries for your keywords, you need to use the related_queries() method of the TrendReq class:
pytrend.build_payload(kw_list, timeframe='today 12-m')
rq = pytrend.related_queries()
rq.values()
df = pd.DataFrame(rq.get('aws s3').get('rising'))
df.head()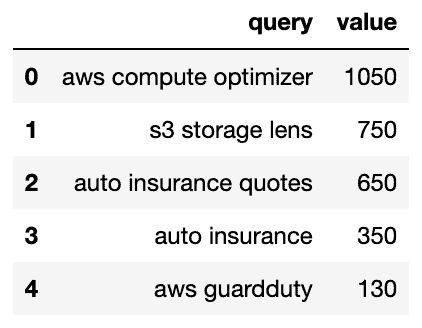
To get related top search queries for your keywords, you need to use the related_queries() method of the TrendReq class:
pytrend.build_payload(kw_list, timeframe='today 12-m')
rq = pytrend.related_queries()
rq.values()
df = pd.DataFrame(rq.get('aws s3').get('top'))
df.head()
Getting topic suggestions
To get topic suggestions for ONE of your keywords, you need to use the suggestions() method of the TrendReq class:
pytrend.build_payload(kw_list, timeframe='today 12-m')
df = pd.DataFrame(pytrend.suggestions('aws s3'))
df.head()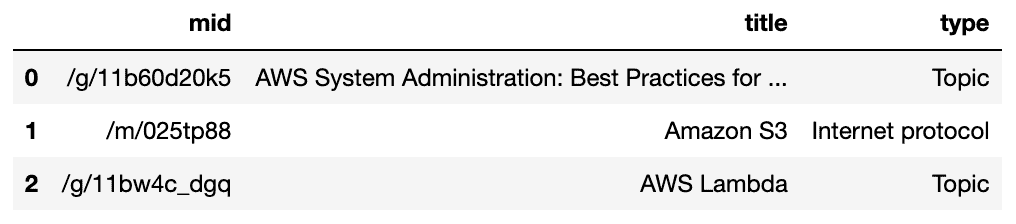
Getting real-time trending searches
To get real-time trending searches, you need to use the trending_searches() method of the TrendReq class:
df = pytrend.trending_searches(pn='united_states')
df.head()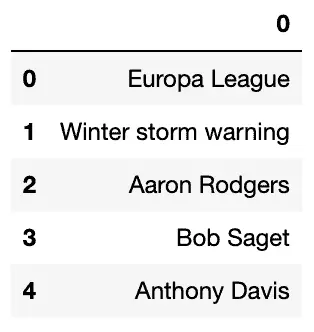
The pn argument specifies the geographical location, the US, in our example.
Use the trending_searches() method without arguments to query worldwide.
Getting real-time search trends
To get real-time search trends, you need to use the realtime_trending_searches() method of the TrendReq class:
df = pytrend.realtime_trending_searches(pn='US')
df.head()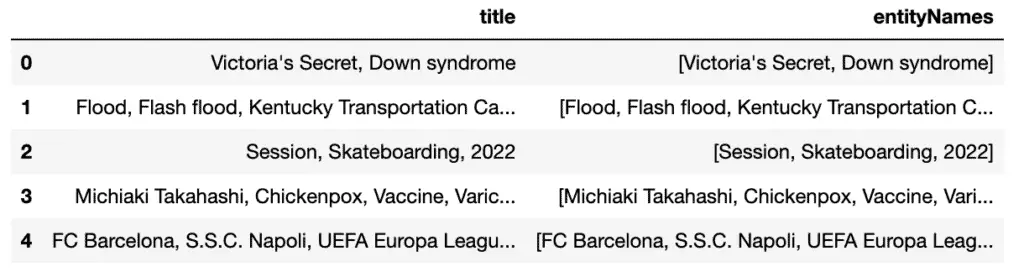
Is there an Official Google Trends API?
Summary
Google Trends is a great service that allows you to research the internet search volume based on users’ search queries to Google. This article covered how to use Google Trends API to analyze internet search queries using Python, Pytrends, and Plotly.
