Terraform CloudWatch Tutorial – Easy AWS automation
Amazon CloudWatch is a service that monitors resources and applications in AWS (Amazon Web Services). With Amazon CloudWatch, you can track the resources and application performance, collect and monitor log file details, and enable your resources’ alarms and notifications to be triggered on specific events.
This article contains Terraform CloudWatch examples demonstrating how to automate alarms, dashboards, and logs in the AWS CloudWatch service.
If you don’t want to develop something customized and are looking for existing Terraform CloudWatch modules, we recommend you check out the “terraform-aws-cloudwatch” CloudWatch Terraform module from the official repository.
Table of contents
Prerequisites
To start managing any AWS services, including AWS IAM, using Terraform, you need to install Terraform on your machine and set up access to your AWS account using the AWS access key. You can also use aws-vault for managing access to multiple AWS environments.
Alternatively, you can set up and launch a Cloud9 IDE Instance.
Terraform CloudWatch – Project Structure
This article comprises four sections: managing AWS CloudWatch alarms, dashboards, and logs using Terraform. Each section of this article has an example that you can execute independently. You can put every example in a separate Terraform *.tf file to achieve the results shown in this article.
Some of the examples in this article are based on open-source Terraform modules. These modules hide and encapsulate your Terraform code’s implementation logic into a reusable resource. You can reuse modules in multiple places of your Terraform project without repeatedly duplicating lots of Terraform code.
Note: you can find every open-source Terraform module code on GitHub. For example, here’s a source code of the terraform-aws-modules/cloudwatch/aws module.
All Terraform files are in the same folder and belong to the same Terraform state file.
Make sure to use commands to avoid unnecessary errors while following the article:
terraform validateto verify your Terraform HCL fileterraform planto check out the desired changes on every Terraform file creationterraform applyto create the resources in AWS
AWS Terraform provider
To start managing the AWS CloudWatch service, you need to declare the AWS Terraform provider in a providers.tf file.
terraform {
required_providers {
aws = {
source = "hashicorp/aws"
version = "3.69.0"
}
}
}
provider "aws" {
profile = "default"
region = "us-east-2"
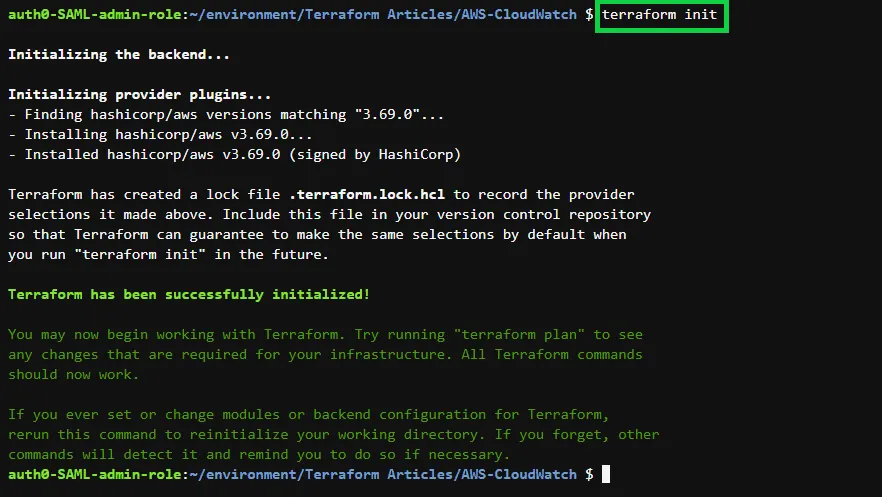
}Run the terraform init command to initialize the Terraform working directory with the AWS plugins.
Here is the execution output.
Create an AWS CloudWatch dashboard using Terraform
To create an AWS CloudWatch dashboard using Terraform, you can use the aws_cloudwatch_dashboard resource and assign the required arguments: the dashboard_name and the dashboard_body. Then, you can refer to the official AWS CloudWatch API reference documentation that defines the recommended dashboard body structure and syntax to build your dashboards.
In the following example, we will create a dashboard that monitors the Maximum CPU utilization of all running EC2 instances in your AWS account.
resource "aws_cloudwatch_dashboard" "EC2_Dashboard" {
  dashboard_name = "EC2-Dashboard"
  dashboard_body = <<EOF
{
    "widgets": [
        {
            "type": "explorer",
            "width": 24,
            "height": 15,
            "x": 0,
            "y": 0,
            "properties": {
                "metrics": [
                    {
                        "metricName": "CPUUtilization",
                        "resourceType": "AWS::EC2::Instance",
                        "stat": "Maximum"
                    }
                ],
                "aggregateBy": {
                    "key": "InstanceType",
                    "func": "MAX"
                },
                "labels": [
                    {
                        "key": "State",
                        "value": "running"
                    }
                ],
                "widgetOptions": {
                    "legend": {
                        "position": "bottom"
                    },
                    "view": "timeSeries",
                    "rowsPerPage": 8,
                    "widgetsPerRow": 2
                },
                "period": 60,
                "title": "Running EC2 Instances CPUUtilization"
            }
        }
    ]
}
EOF
}
After running terraform apply, you can log in to the AWS console and access the CloudWatch service dashboard, where you should be able to see the maximum CPU utilization of all the running EC2 instances in your AWS account.

Manage AWS CloudWatch metrics using Terraform
This article section will cover how to manage AWS CloudWatch metrics using Terraform.
Create an AWS CloudWatch metric alarm
To create an AWS CloudWatch metric alarm, you can use the aws_cloudwatch_metric_alarm resource and pass the required arguments, such as the alarm_name, comparison_operator, and evaluation_periods.
resource "aws_cloudwatch_metric_alarm" "EC2_CPU_Usage_Alarm" {
  alarm_name                = "EC2_CPU_Usage_Alarm"
  comparison_operator       = "GreaterThanOrEqualToThreshold"
  evaluation_periods        = "2"
  metric_name               = "CPUUtilization"
  namespace                 = "AWS/EC2"
  period                    = "60"
  statistic                 = "Average"
  threshold                 = "70"
  alarm_description         = "This metric monitors ec2 cpu utilization exceeding 70%"
}
Alternatively, you can create an AWS CloudWatch metric using the official Terraform AWS CloudWatch module.
module "metric_alarm" {
  source  = "terraform-aws-modules/cloudwatch/aws//modules/metric-alarm"
  version = "~> 2.0"
  alarm_name          = "EC2_CPU_Usage"
  comparison_operator = "GreaterThanOrEqualToThreshold"
  evaluation_periods  = 2
  threshold           = 70
  period              = 60
  unit                = "Count"
  namespace   = "AWS/EC2"
  metric_name = "CPUUtilization"
  statistic   = "Average"
  alarm_actions = ["arn:aws:sns:us-east-2:585584209241:cpu_utilization"]
}
Create an AWS CloudWatch metric alarm with EC2 Autoscaling
You can create an AWS CloudWatch metric alarm that triggers multiple actions depending on the defined CloudWatch metric alarm conditions. In the following example, we shall create an AWS CloudWatch metric alarm that monitors the average CPU usage and triggers an AWS AutoScaling policy to spin up more EC2 instances in an AWS AutoScaling group, should the average CPU Utilization average at 70 % for one minute. The depends_on meta-argument is used to ensure that the creation of one resource depends first on the creation of the referenced resource.
The aws_launch_template resource provides an EC2 launch template resource to use with the AutoScaling group. While the aws_autoscaling_group resource is used to create and define an AWS AutoScaling group’s properties, the aws_autoscaling_policy resource is used to create and define the AutoScaling policy properties of your EC2 instances.
resource "aws_launch_template" "EC2_Launch_Template" {
  name_prefix   = "EC2-Launch-Template"
  image_id      = "ami-0f540030bb04d884a"
  instance_type = "t2.micro"
}
resource "aws_autoscaling_group" "EC2_AutoScaling_Group" {
  availability_zones = ["us-east-2b"]
  desired_capacity   = 1
  max_size           = 5
  min_size           = 1
  launch_template {
    id      = aws_launch_template.EC2_Launch_Template.id
    version = "$Latest"
  }
  depends_on = [
    aws_launch_template.EC2_Launch_Template,
  ]
}

resource "aws_autoscaling_policy" "EC2_AutoScaling_Policy" {
  name                   = "EC2-AutoScaling-Policy"
  scaling_adjustment     = 2
  adjustment_type        = "ChangeInCapacity"
  cooldown               = 60
  autoscaling_group_name = aws_autoscaling_group.EC2_AutoScaling_Group.name
  depends_on = [
    aws_autoscaling_group.EC2_AutoScaling_Group,
  ]
}
resource "aws_cloudwatch_metric_alarm" "EC2_metric_alarm" {
  alarm_name          = "EC2-metric-alarm"
  comparison_operator = "GreaterThanOrEqualToThreshold"
  evaluation_periods  = "1"
  metric_name         = "CPUUtilization"
  namespace           = "AWS/EC2"
  period              = "60"
  statistic           = "Average"
  threshold           = "70"
  depends_on = [
    aws_autoscaling_group.EC2_AutoScaling_Group,
  ]
  dimensions = {
    AutoScalingGroupName = aws_autoscaling_group.EC2_AutoScaling_Group.name
  }

  alarm_description = "This metric monitors ec2 cpu utilization"
  alarm_actions     = [aws_autoscaling_policy.EC2_AutoScaling_Policy.arn]
}
Create an AWS CloudWatch metric stream
AWS CloudWatch metric streams send metrics to a real-time destination such as Amazon S3 (Simple Storage Service). For example, you can create a metric stream and connect it to an Amazon Kinesis Data Firehose delivery stream that delivers your metrics to Amazon S3. The data sent can later be used for your purposes, such as analyzing resource performance.
To create an AWS CloudWatch metric stream, use the aws_cloudwatch_metric_stream and assign the required arguments, such as the firehose_arn, role_arn, and output_format. The include_filter argument is used to specify the namespaces you want to send metrics to S3. In this case, we are using AWS/EC2 and AWS/EBS.
In the following example, the aws_iam_role and aws_iam_role_policy terraform resources are used to provide the required permissions to the roles required by AWS CloudWatch metrics and the firehose delivery stream to access Amazon S3. The aws_s3_bucket resource is used to create the destination Amazon S3 bucket.
resource "aws_cloudwatch_metric_stream" "main" {
  name          = "my-metric-stream"
  role_arn      = aws_iam_role.metric_stream_to_firehose.arn
  firehose_arn  = aws_kinesis_firehose_delivery_stream.s3_stream.arn
  output_format = "json"
  include_filter {
    namespace = "AWS/EC2"
  }
  include_filter {
    namespace = "AWS/EBS"
  }
}
resource "aws_iam_role" "metric_stream_to_firehose" {
  name = "metric_stream_to_firehose_role"
  assume_role_policy = <<EOF
{
  "Version": "2012-10-17",
  "Statement": [
    {
      "Action": "sts:AssumeRole",
      "Principal": {
        "Service": "streams.metrics.cloudwatch.amazonaws.com"
      },
      "Effect": "Allow",
      "Sid": ""
    }
  ]
}
EOF
}
resource "aws_iam_role_policy" "metric_stream_to_firehose" {
  name = "default"
  role = aws_iam_role.metric_stream_to_firehose.id
  policy = <<EOF
{
    "Version": "2012-10-17",
    "Statement": [
        {
            "Effect": "Allow",
            "Action": [
                "firehose:PutRecord",
                "firehose:PutRecordBatch"
            ],
            "Resource": "${aws_kinesis_firehose_delivery_stream.s3_stream.arn}"
        }
    ]
}
EOF
}
resource "aws_s3_bucket" "bucket" {
  bucket = "test-metric-stream-bucket"
  acl    = "private"
}
resource "aws_iam_role" "firehose_to_s3" {
  assume_role_policy = <<EOF
{
  "Version": "2012-10-17",
  "Statement": [
    {
      "Action": "sts:AssumeRole",
      "Principal": {
        "Service": "firehose.amazonaws.com"
      },
      "Effect": "Allow",
      "Sid": ""
    }
  ]
}
EOF
}
resource "aws_iam_role_policy" "firehose_to_s3" {
  name = "default"
  role = aws_iam_role.firehose_to_s3.id
  policy = <<EOF
{
    "Version": "2012-10-17",
    "Statement": [
        {
            "Effect": "Allow",
            "Action": [
                "s3:AbortMultipartUpload",
                "s3:GetBucketLocation",
                "s3:GetObject",
                "s3:ListBucket",
                "s3:ListBucketMultipartUploads",
                "s3:PutObject"
            ],
            "Resource": [
                "${aws_s3_bucket.bucket.arn}",
                "${aws_s3_bucket.bucket.arn}/*"
            ]
        }
    ]
}
EOF
}
resource "aws_kinesis_firehose_delivery_stream" "s3_stream" {
  name        = "metric-stream-test-stream"
  destination = "s3"
  s3_configuration {
    role_arn   = aws_iam_role.firehose_to_s3.arn
    bucket_arn = aws_s3_bucket.bucket.arn
  }
}
Create an AWS CloudWatch composite alarm
AWS CloudWatch Composite alarms are used to monitor two or more alarms to determine the alarm state and take action. The most common use of Composite alarms is to reduce alarm notifications by grouping multiple alarms and defining which metrics within’ alarms should trigger the different alarm states. When you set up a composite alarm, you will only be notified when the specified metrics from the different alarms are reached.
To create a Composite alarm using Terraform, you can use the aws_cloudwatch_composite_alarm resource and pass the required argument, which is the alarm_name
The aws_sns_topic and the aws_sns_topic_subscription resources are used to configure notifications sent to the User when the composite alarm reaches the desired alarm state.
resource "aws_cloudwatch_composite_alarm" "EC2_and_EBS" {
  alarm_description = "Composite alarm that monitors CPUUtilization and EBS Volume Write Operations"
  alarm_name        = "EC2_&EBS_Composite_Alarm"
  alarm_actions = [aws_sns_topic.EC2_and_EBS_topic.arn]
  alarm_rule = "ALARM(${aws_cloudwatch_metric_alarm.EC2_CPU_Usage_Alarm.alarm_name}) OR ALARM(${aws_cloudwatch_metric_alarm.EBS_WriteOperations.alarm_name})"

  depends_on = [
    aws_cloudwatch_metric_alarm.EC2_CPU_Usage_Alarm,
    aws_cloudwatch_metric_alarm.EBS_WriteOperations,
    aws_sns_topic.EC2_and_EBS_topic,
    aws_sns_topic_subscription.EC2_and_EBS_Subscription
  ]
}

resource "aws_cloudwatch_metric_alarm" "EC2_CPU_Usage_Alarm" {
  alarm_name          = "EC2_CPU_Usage_Alarm"
  comparison_operator = "GreaterThanOrEqualToThreshold"
  evaluation_periods  = "2"
  metric_name         = "CPUUtilization"
  namespace           = "AWS/EC2"
  period              = "60"
  statistic           = "Average"
  threshold           = "70"
  alarm_description   = "This metric monitors ec2 cpu utilization exceeding 70%"
}

resource "aws_cloudwatch_metric_alarm" "EBS_WriteOperations" {
  alarm_name          = "EBS_WriteOperations"
  comparison_operator = "GreaterThanOrEqualToThreshold"
  evaluation_periods  = "2"
  metric_name         = "VolumeReadOps"
  namespace           = "AWS/EC2"
  period              = "120"
  statistic           = "Average"
  threshold           = "1000"
  alarm_description   = "This monitors the average read operations on EBS Volumes in a specified period of time"
}

resource "aws_sns_topic" "EC2_and_EBS_topic" {
  name = "EC2_and_EBS_topic"
}
resource "aws_sns_topic_subscription" "EC2_and_EBS_Subscription" {
  topic_arn = aws_sns_topic.EC2_and_EBS_topic.arn
  protocol  = "email"
  endpoint  = "kelvingalabuzi@gmail.com"
  depends_on = [
    aws_sns_topic.EC2_and_EBS_topic
  ]
}
Managing AWS CloudWatch Logs using Terraform
This article section will cover how to manage AWS CloudWatch logs using Terraform.
Create an AWS CloudWatch log group
A log group in AWS CloudWatch defines a collection of log streams that share the same retention, monitoring, and access control settings. To create an AWS CloudWatch log group using Terraform, use the aws_cloudwatch_log_group resource and assign arguments such as the name of the log group.
resource "aws_cloudwatch_log_group" "EC2_logGroup" {
  name = "EC2_logGroup"
  retention_in_days = 30
}
Alternatively, you can create an AWS CloudWatch log group using the official Terraform AWS CloudWatch module.
module "log_group" {
  source  = "terraform-aws-modules/cloudwatch/aws//modules/log-group"
  version = "~> 2.0"
  name              = "lambda_logGroup"
  retention_in_days = 120
}
Create an AWS CloudWatch log stream
A log stream is a sequence of events sharing the same source. AWS CloudWatch log groups can have one or more log streams. To create an AWS CloudWatch log stream, use the aws_cloudwatch_log_stream resource and assign the required arguments, which are the name of the log stream and the log_group_name
resource "aws_cloudwatch_log_group" "ebs_log_group" {
  name = "ebs_log_group"
}
resource "aws_cloudwatch_log_stream" "ebs_log_stream" {
  name           = "ebs_log_stream"
  log_group_name = aws_cloudwatch_log_group.ebs_log_group.name
}
Create an AWS CloudWatch log metric filter
AWS CloudWatch metric filters are used to extract information from events. They define the terms and patterns to look for in log data as it’s sent to CloudWatch logs. The data from the metric filters can be turned into CloudWatch metrics, which can then be graphed or used to set alarms. To create an AWS CloudWatch metric filter, use the aws_cloudwatch_log_metric_filter resource and assign all the required arguments.
resource "aws_cloudwatch_log_metric_filter" "ElasticBeanStalk_metric_filter" {
  name           = "ElasticBeanStalk_metric_filter"
  pattern        = "ERROR"
  log_group_name = aws_cloudwatch_log_group.ElasticBeanStalk_log_group.name
  metric_transformation {
    name      = "ErrorCount"
    namespace = "ElasticBeanstalk"
    value     = "1"
  }
}
resource "aws_cloudwatch_log_group" "ElasticBeanStalk_log_group" {
  name = "ElasticBeanStalk_log_group"
}
Create an AWS CloudWatch log subscription filter
Amazon CloudWatch log subscription filters associate events that match a specific pattern found in a log group with Kinesis, Lamba, or Firehose for additional processing. To create an AWS CloudWatch log subscription filter, you can use the aws_cloudwatch_log_subscription_filter resource and assign the required arguments, such as the name of the subscription filter, destination_arn, and filter_pattern
resource "aws_cloudwatch_log_subscription_filter" "route53_logfilter" {
  name            = "route53_logfilter"
  role_arn        = aws_iam_role.kinesis_subscription_filter_role.arn
  log_group_name  = "route53_logs"
  filter_pattern  = "testpattern"
  destination_arn = aws_kinesis_stream.route53_kinesis_stream.arn
  distribution    = "Random"
  depends_on = [
  aws_kinesis_stream.route53_kinesis_stream,
  aws_iam_role.kinesis_subscription_filter_role
  ]
}

resource "aws_kinesis_stream" "route53_kinesis_stream" {
  name             = "route53_kinesis_stream"
  shard_count      = 1
  retention_period = 30
  shard_level_metrics = [
    "IncomingBytes",
    "OutgoingBytes",
  ]
  stream_mode_details {
    stream_mode = "PROVISIONED"
  }
}
resource "aws_iam_role" "kinesis_subscription_filter_role" {
  name = "kinesis_subscription_filter_role"
  managed_policy_arns = [aws_iam_policy.subscription_filter_policy.arn]
  assume_role_policy = jsonencode({
    Version = "2012-10-17"
    Statement = [
      {
        Action = "sts:AssumeRole"
        Effect = "Allow"
        Sid    = ""
        Principal = {
          Service = ["logs.amazonaws.com",
          "kinesis.amazonaws.com"
          ]
        }
      },
    ]
  })
  }

  resource "aws_iam_policy" "subscription_filter_policy" {
  name        = "subscription_filter_policy"
  policy = jsonencode({
    Version = "2012-10-17"
    Statement = [
      {
        Action   = ["logs:*", "route53:*", "kinesis:*"]
        Effect   = "Allow"
        Resource = "*"
      },
    ]
  })
}
Create an AWS CloudWatch log resource policy
An AWS CloudWatch log resource policy allows an AWs service to log events to a log group. In the following example, we will create an AWS CloudWatch log resource policy enabling Route53 to log to a log group. To create the resource policy, you can use the aws_cloudwatch_log_resource_policy resource and assign the required arguments, which are the policy_document and the policy_name
data "aws_iam_policy_document" "route53-logging-policy" {
  statement {
    actions = [
      "logs:CreateLogStream",
      "logs:PutLogEvents",
    ]
    resources = ["rn:aws:logs:us-east-2:585584209241:log-group:route53_logs:*"]
    principals {
      identifiers = ["route53.amazonaws.com"]
      type        = "Service"
    }
  }
}
resource "aws_cloudwatch_log_resource_policy" "route53-logging-policy" {
  policy_document = data.aws_iam_policy_document.route53-logging-policy.json
  policy_name     = "route53-logging-policy"
}
Create an AWS CloudWatch log destination
An AWS CloudWatch log destination allows you to create a destination to which CloudWatch logs can send logs. To create an AWS CloudWatch log destination, you can use the aws_cloudwatch_log_destination resource and assign the required arguments, such as the name of the log destination, role_arn and target_arn. The log destination resource depends on creating two more AWS resources, such as the aws_iam_role to grant CloudWatch logs to send logs to a destination, and the aws_kinesis_stream resource.
resource "aws_iam_role" "cloudwatch_log_destination_role" {
  name = "cloudwatch_log_destination_role"
  managed_policy_arns = [aws_iam_policy.cloudwatch_log_destination_policy.arn]
  assume_role_policy = jsonencode({
    Version = "2012-10-17"
    Statement = [
      {
        Action = "sts:AssumeRole"
        Effect = "Allow"
        Sid    = ""
        Principal = {
          Service = [
          "logs.amazonaws.com"
          ]

        }
      },
    ]
   })
  }

  resource "aws_iam_policy" "cloudwatch_log_destination_policy" {
  name        = "cloudwatch_log_destination_policy"
  policy = jsonencode({
    Version = "2012-10-17"
    Statement = [
      {
        Action   = ["logs:*", "kinesis:*"]
        Effect   = "Allow"
        Resource = "*"
      },
    ]
  })
}

resource "aws_kinesis_stream" "Kinesis_stream" {
  name             = "Kinesis_stream"
  shard_count      = 1
  retention_period = 48
  shard_level_metrics = [
    "IncomingBytes",
    "OutgoingBytes",
  ]
  stream_mode_details {
    stream_mode = "PROVISIONED"
  }
}
resource "aws_cloudwatch_log_destination" "EC2_log_destination" {
  name       = "EC2_log_destination"
  role_arn   = aws_iam_role.cloudwatch_log_destination_role.arn
  target_arn = aws_kinesis_stream.Kinesis_stream.arn
  depends_on = [
    aws_iam_role.cloudwatch_log_destination_role,
    aws_kinesis_stream.Kinesis_stream
  ]
}
Create an AWS CloudWatch query definition using Terraform
To create an AWS CloudWatch query definition, you can use the aws_cloudwatch_query_definition resource and assign the required arguments: the name of the query and the query_string.
resource "aws_cloudwatch_query_definition" "demo_definition" {
  name = "demo_query"
  log_group_names = [
    "route53_logs"
  ]
  query_string = <<EOF
fields @timestamp, @message
| sort @timestamp desc
| limit 25
EOF
}
Create an AWS CloudWatch event rule using Terraform
Amazon CloudWatch events stream system events performed on AWS resources in real-time. Rules are used to match incoming events and route them to targets. To create an AWS CloudWatch event rule, you can use the aws_cloudwatch_event_rule resource and assign some optional parameters. Then, the event rule is used with the aws_cloudwatch_event_target resource using an SNS topic target. In the following example, we will create an event rule that monitors AWS console sign-ins and sends the events to an SNS topic.
resource "aws_cloudwatch_event_rule" "console" {
  name        = "capture-aws-sign-in"
  description = "Capture each AWS Console Sign In"
  event_pattern = <<EOF
{
  "detail-type": [
    "AWS Console Sign In via CloudTrail"
  ]
}
EOF
}
resource "aws_cloudwatch_event_target" "sns" {
  rule      = aws_cloudwatch_event_rule.console.name
  target_id = "SendToSNS"
  arn       = aws_sns_topic.aws_logins.arn
}
resource "aws_sns_topic" "aws_logins" {
  name = "aws-console-logins"
}
resource "aws_sns_topic_policy" "default" {
  arn    = aws_sns_topic.aws_logins.arn
  policy = data.aws_iam_policy_document.sns_topic_policy.json
}
data "aws_iam_policy_document" "sns_topic_policy" {
  statement {
    effect  = "Allow"
    actions = ["SNS:Publish"]
    principals {
      type        = "Service"
      identifiers = ["events.amazonaws.com"]
    }
    resources = [aws_sns_topic.aws_logins.arn]
  }
}
Summary
This article used Terraform to automate alarms, dashboards, and logs in the AWS CloudWatch service.
