VPC Flow Logs – Complete Terraform solution
Running a complex network is not an easy job. In addition to simply keeping it up and running, you need to keep an ever-watchful eye out for unusual traffic patterns or content that could signify a network intrusion, a compromised instance, or another anomaly. This Terraform demo shows how to monitor VPC Flow Logs, Traffic Mirroring using Amazon Athena, OpenSearch, Suricata, and Guard Duty.
Table of contents
An ability to monitor VPC flow logs and traffic is an essential hands-on skill for AWS Certified Solutions Architect Associate and AWS Certified Solutions Architect Professional certifications.
Prerequisites
In this article, we’ll use Terraform to set up the following AWS services:
- Amazon VPC (2 public, 2 private subnets, Internet Gateway, NAT Gateways)
- VPC Flow Logs (VPC, Subnet, Interface)
- Amazon Athena
- Amazon OpenSearch (Elasticsearch)
- Amazon EC2
- AWS Systems Manager Session Manager
We’ll use Amazon EC2 instances with the following roles:
- Demo EC2 instance to analyze traffic from
- Suricata – an open source-based intrusion detection system and intrusion prevention system (sends alerts to ElasticSearch, deployed as a Docker container)
- Windows Jumphost – to get access to Kibana (Elasticsearch Dashboard)
You can find all source code in our GitHub repository:
- amazon-vpc-traffic-inspection-and-monitoring – Terraform modules to deploy all infrastructure components
Note: all Terraform modules rely on the remote state stored in the S3 bucket and use DynamoDB for execution lock. You can deploy this infrastructure using the 0_remote_state module.
We recommend accomplishing the MKT210 – Amazon VPC Traffic Mirroring Builder Session workshop before automating everything using Terraform.
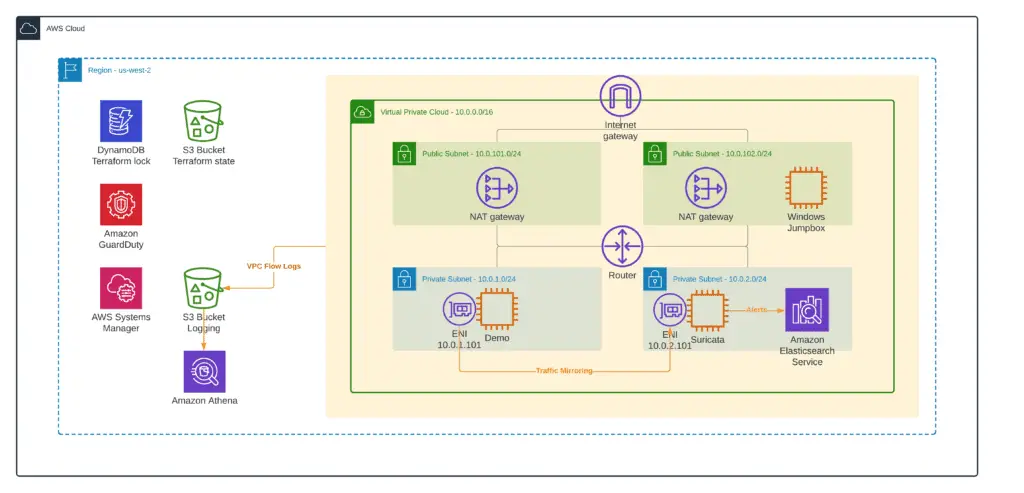
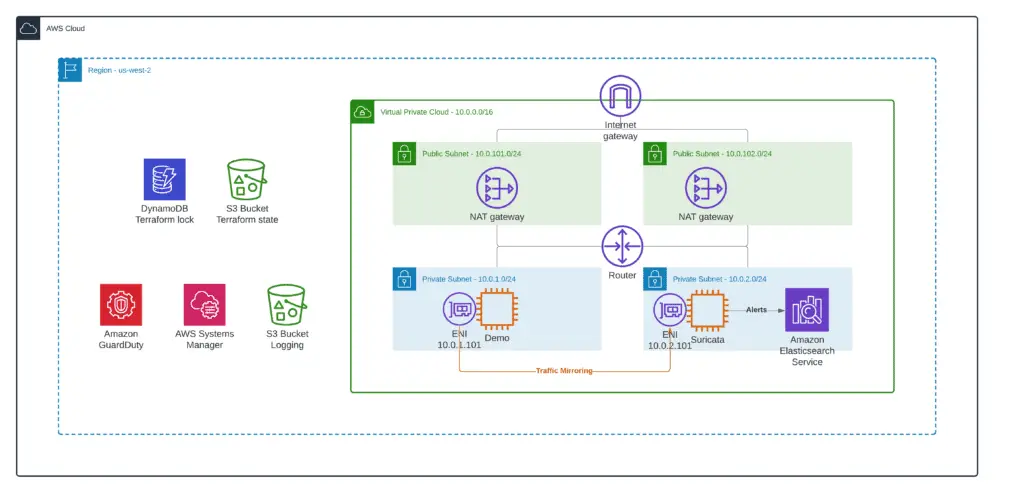
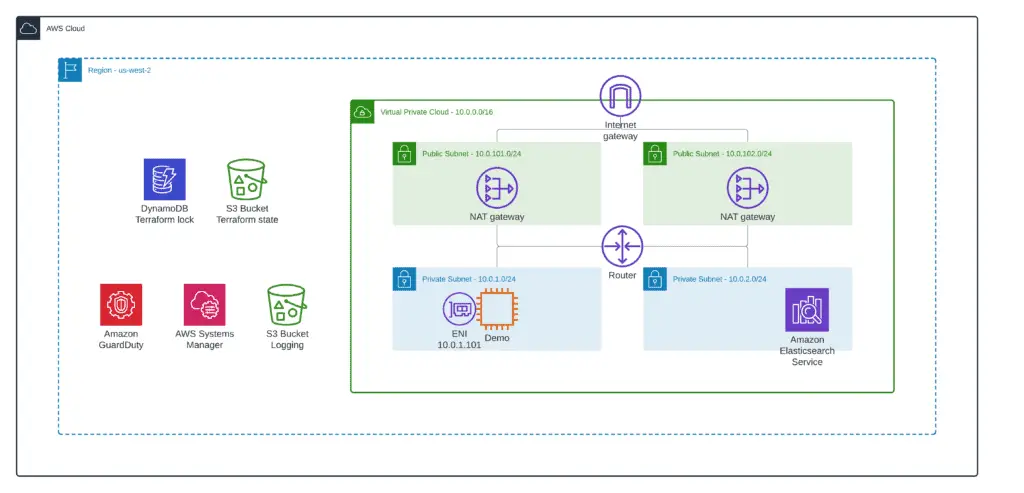
VPC environment
Before analyzing VPC Flow Logs and VPC Traffic mirroring, we need to set up a base demo VPC environment. Here’s what it will look like:

To deploy this environment, you need to apply the 1_base_infrastructure module from our amazon-vpc-traffic-inspection-and-monitoring GitHub Repository:
cd 1_base_infrastructure
terraform init
terraform apply -auto-approve
If you’re interested in more in-depth information on creating a VPC infrastructure using Terraform, please, check out our previous posts:
- Terraform – Managing AWS VPC – Creating a public subnet
- Terraform – Managing AWS VPC – Creating private subnets
Once you’ve deployed the module, you can connect to the Demo EC2 instance using AWS Systems Manager Session Manager.
Select your EC2 instance and click the Connect button:
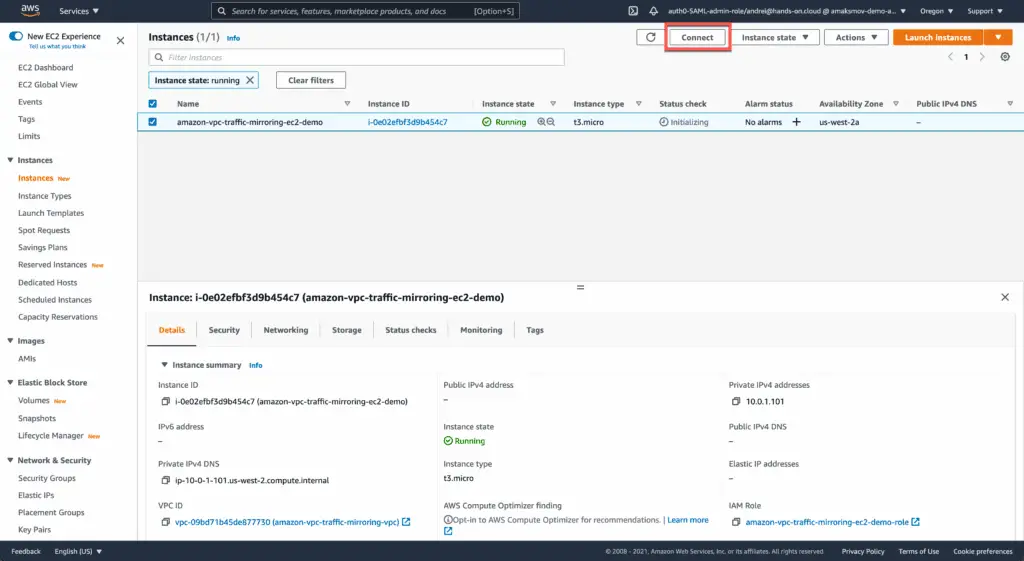
Choose the Session Manager tab and hit the Connect button:

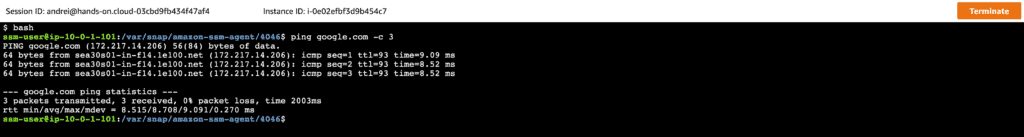
Now, you can test the Internet connectivity by executing the following commands:
bash
ping google.com -c 3
Here’s an execution output:
As soon as we have our VPC infrastructure in place, we can enable VPC Flow Logging.
VPC Flow Logs
VPC Flow Logs is a helpful feature that lets you capture traffic flows within a VPC. Traffic logs are sent to an endpoint of your choosing, most commonly, we publish Flow Logs to the Amazon S3 bucket or Amazon CloudWatch. We’ll move forward with the S3 bucket as a log destination.
You can choose what traffic to capture: accepted, rejected, or both.
You don’t have any controls to filter the traffic by source, destination, protocol, or other parameters. We’ll show you how to do it later by using Amazon Athena.
Usually, the generated traffic flow logs appear at your destination with some delay (from 5 to 15 mins). You can speed up this process by reducing the aggregation time to 1 minute.
Entire VPC
You can enable Amazon VPC Flow Logs for the entire VPC:

You must apply the 2_vpc_logging module from our demo repository to make this happen.
This module uses the aws_flow_log Terraform resource to enable Flow Logs.
Subnet
If you need more fine granular control over which traffic to capture, you can enable Flow Log to capture IP traffic at the subnet level:

To make this happen, you need to apply the 3_subnet_logging module from our demo repository.
This module uses the aws_flow_log Terraform resource to enable VPC Flow Logs.
Network interface (ENI)
Finally, you can enable VPC Flow Logs for a specific network interface:
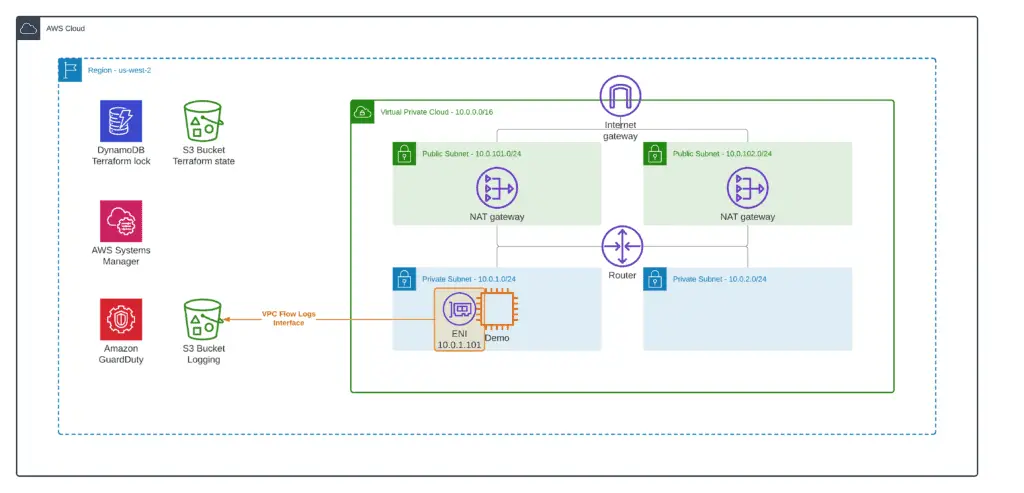
To make this happen, you need to apply the 4_interface_logging module from our demo repository.
This module uses the aws_flow_log Terraform resource to enable VPC Flow Logs.
VPC Flow Logs analysis using Amazon Athena
Amazon Athena is an interactive query service that makes it easy to analyze data in Amazon S3 using standard SQL. As soon as our VPC Flow Logs are stored in the S3 bucket, Amazon Athena will be a perfect tool to query their information.
Here’s what we will set up:
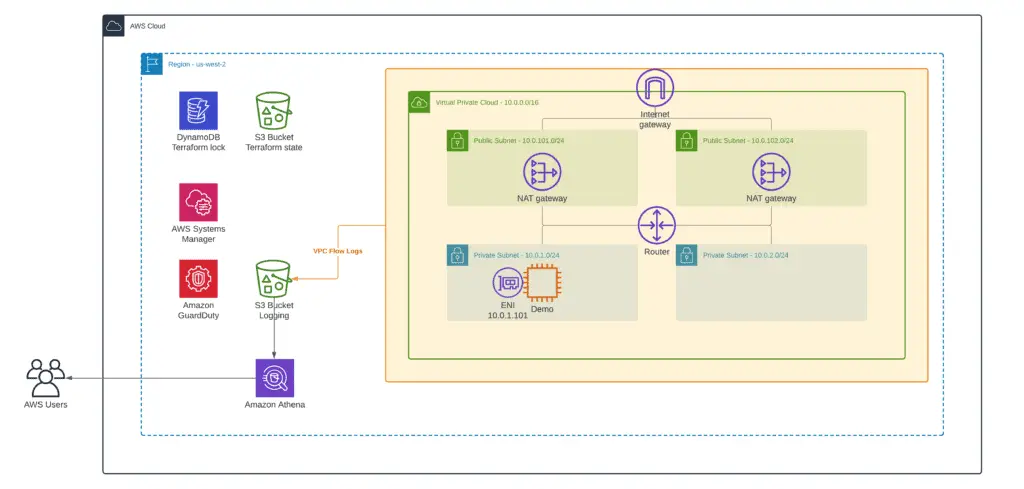
To set up Amazon Athena, you must apply the 5_athena_setup module from our demo repository.
Note: Terraform can’t execute SQL commands, so we’ll use it to create saved queries to simplify Athena table creation and partitioning setup.
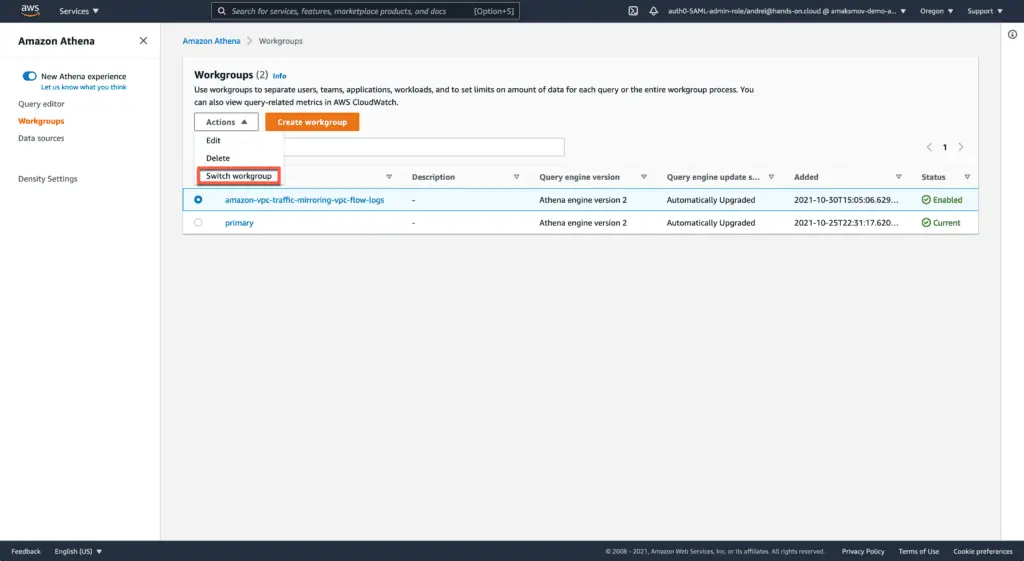
As soon as you’ve applied the module, go to Athena AWS Management Console and switch the current workgroup to the amazon-vpc-traffic-mirroring-vpc-flow-logs:
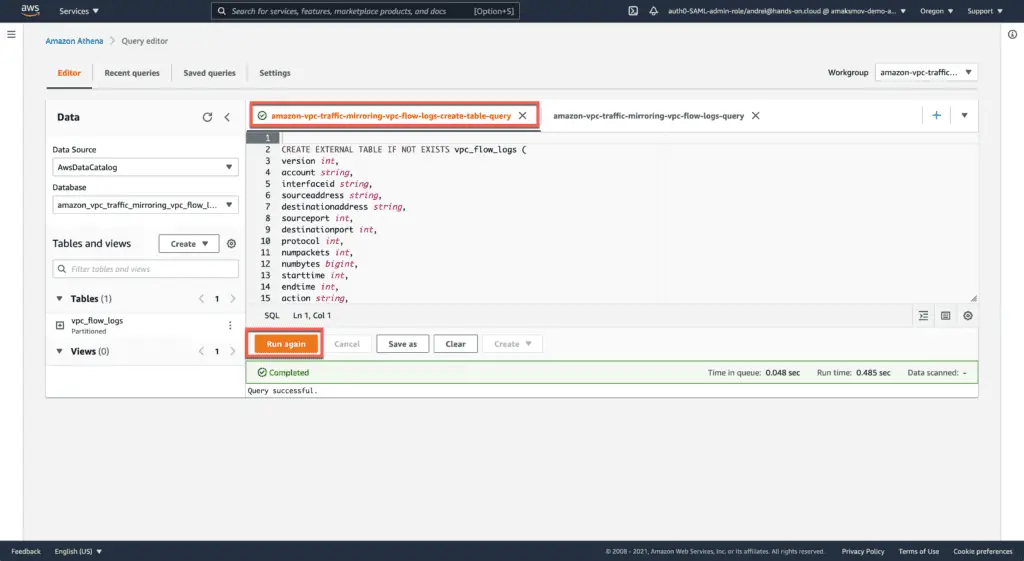
Now, go to the Query editor and execute the Athena table creation query:
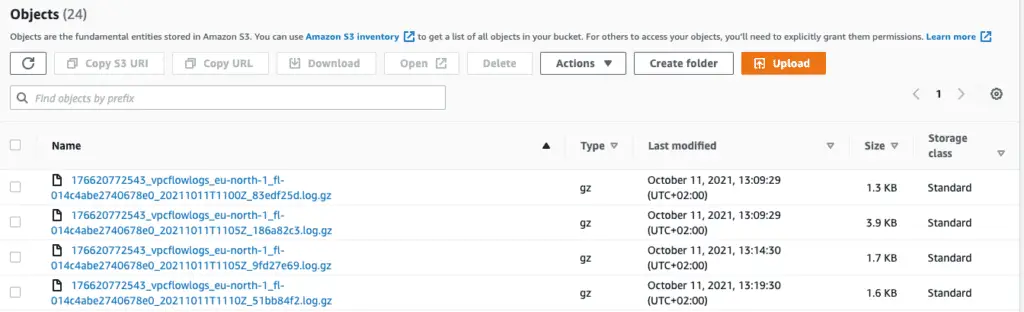
To stimulate some traffic, let’s run the curl command in a simple Bash while-loop at Demo EC2 instance:
while true; do curl google.com; sleep 30; doneWithin a few minutes, logs should start appearing in our S3 bucket:
You can now begin querying VPC Flow Log records using Amazon Athena.
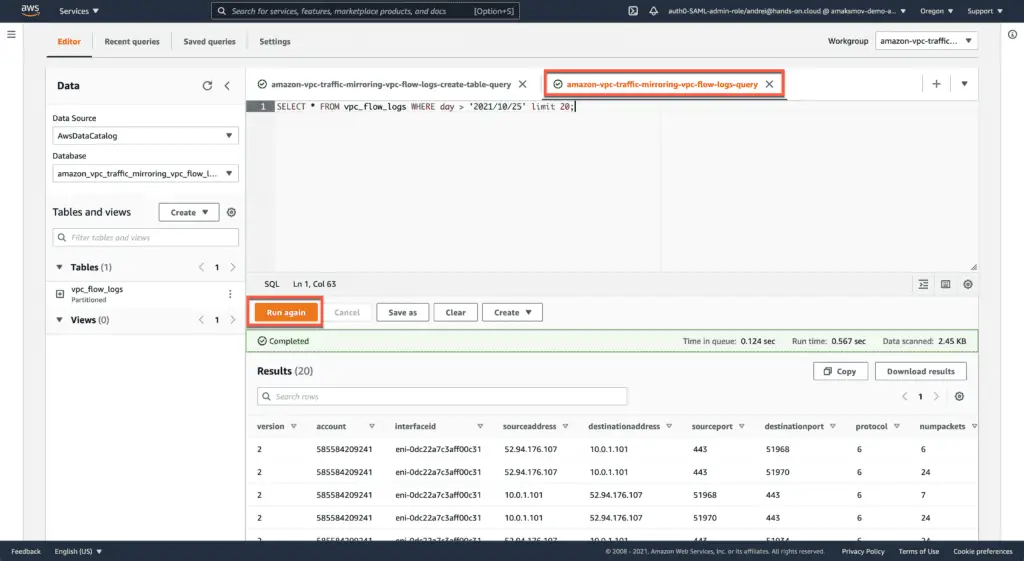
In our example, we’ve queried 20 records from VPC Flow Logs starting from the 25th of October 2021:
SELECT * FROM vpc_flow_logs WHERE day > '2021/10/25' limit 20;You’re using the basic SQL syntax to query any traffic information you’d like.
For example, to filter by the source IP address, execute the following query:
SELECT * FROM vpc_flow_logs WHERE sourceaddress='10.0.1.101';To filter by the destination address, run the following query:
SELECT * FROM vpc_flow_logs WHERE destinationaddress='54.246.214.20';You can combine query conditions using AND statement in your SQL WHERE block:
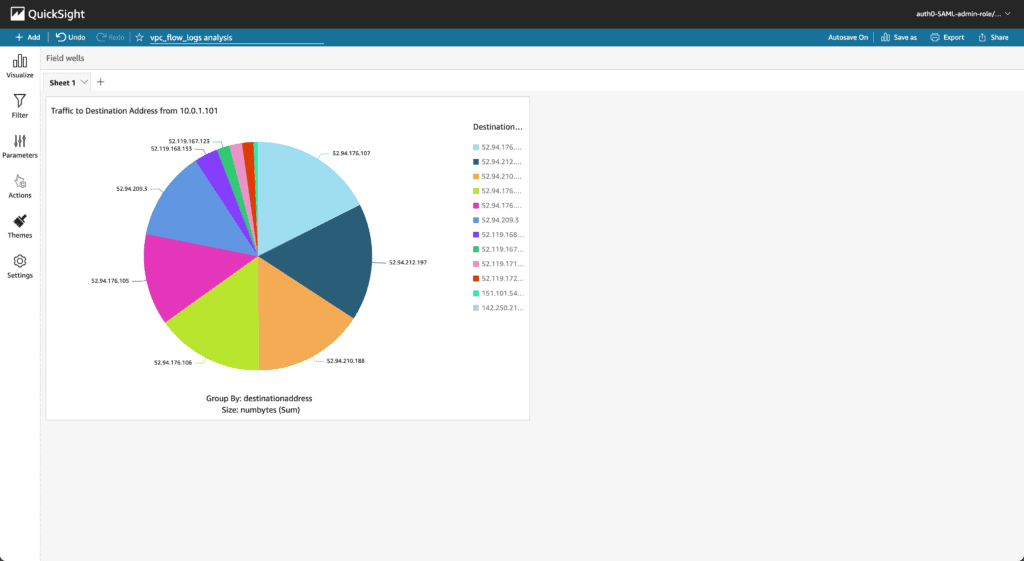
SELECT * FROM vpc_flow_logs WHERE sourceaddress='10.0.1.101' AND destinationport=80;You can integrate Amazon Athena with QuickSight to make any VPC Flow Logs data visualizations or review rejected traffic patterns.
Here’s an example of Demo EC2 instance traffic grouped by destination visualized in QuickSight:
VPC Traffic Mirroring
There are some situations when VPC Flow Logs information is insufficient, and we need to see more detail about the packets flowing around your VPC. This is a perfect use case for setting up Traffic Mirroring. Setting up a Traffic Mirroring for Network Interface within a VPC is the equivalent of configuring a SPAN port on a Network Switch.
The traffic mirroring feature provides several benefits:
- No agent is required on the EC2 instances
- Traffic captures can be forwarded to anywhere inside or outside the VPC
- Advanced traffic analysis can be done in combination with third-party tools
Traffic Mirroring filters can be attached to any (EC2 instance or Network Load Balancer) ENI interfaces.
Compared to VPC Flow Logs, traffic mirroring allows packet capture filtering. If you are interested only in a specific destination or port, you can dramatically reduce the amount of traffic captured and forwarded to the analytics platform.
You can configure two deployment models forwarding packet captures to the target.
The first deployment model assumes you’re configuring traffic forwarding to a single target. The target can be either a single instance or multiple instances behind a Network Load Balancer.
To simplify an article a bit, we’ll use this deployment model precisely and configure Suricata open-source solution to capture mirrored traffic flows:
Putting Suricata or any other network traffic analysis tools behind the Load Balancer makes sense if you are processing significant traffic volumes.
For more information about this deployment model, consider reading the following articles from the AWS blog Using VPC Traffic Mirroring to monitor and secure your AWS infrastructure.
Scaling network traffic inspection using AWS Gateway Load Balancer
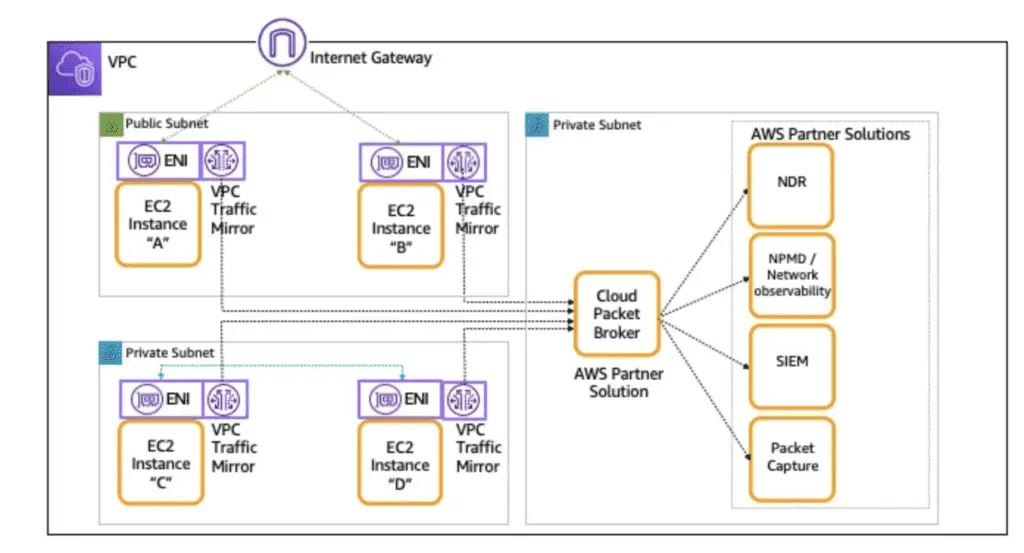
The second deployment model is when the same traffic is sent to multiple network traffic analysis platforms. In this instance, you would need a Cloud Broker platform to replicate the traffic and forward it to various endpoints:
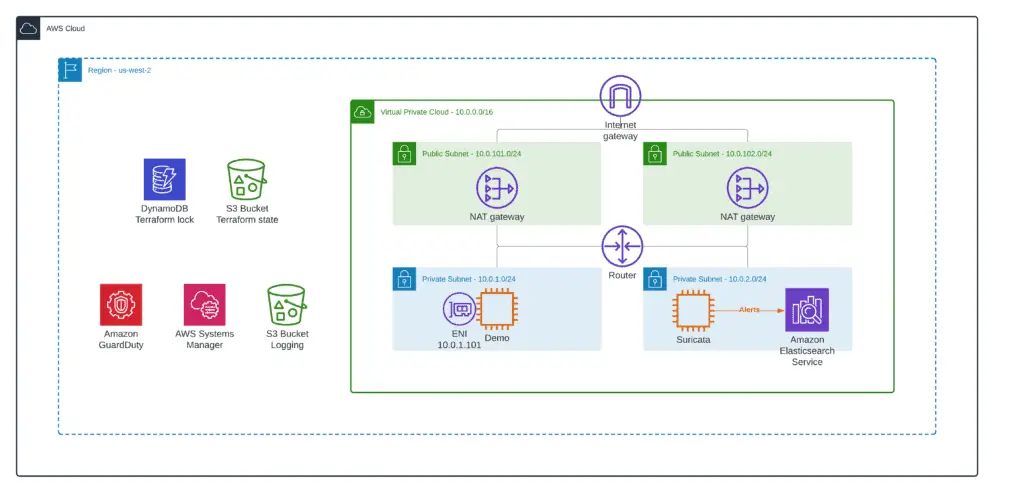
Amazon OpenSearch (Elasticsearch)
Two open-source solutions are mentioned in official AWS documentation for processing mirrored traffic right now: Zeek and Suricata.
Both solutions require the Elasticsearch setup for traffic analysis.
To deploy the Amazon OpenSearch (Elasticsearch), you must apply the 6_elk_stack module from our demo repository.
This module will deploy the Amazon OpenSearch (Elasticsearch) instance in the private subnet of our VPC.
If you’d like to deploy ElasticSearch in HA mode, check out our article Terraform recipe – How to create AWS ElasticSearch cluster.
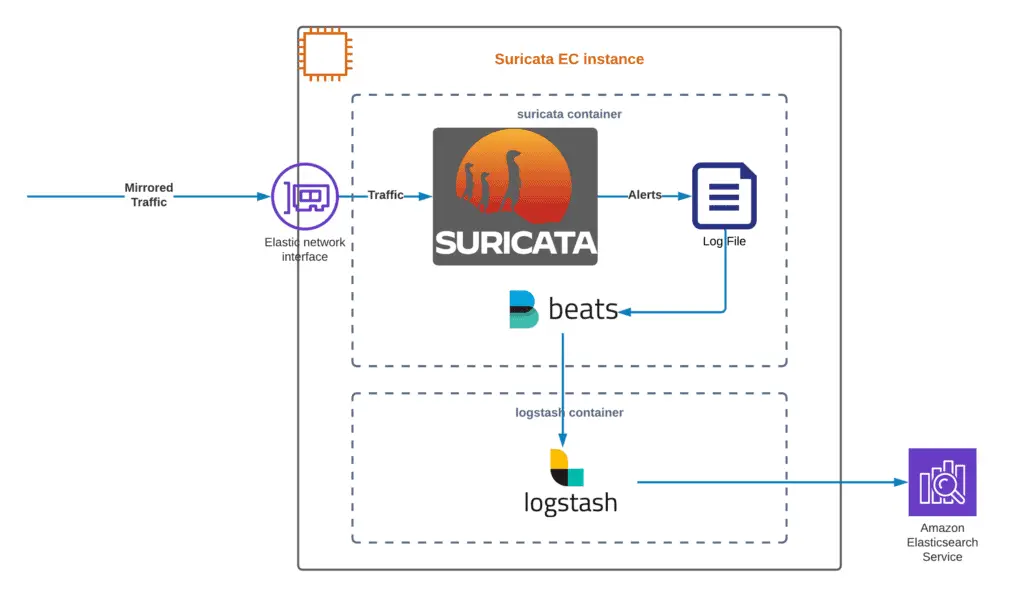
Suricata
Two open-source solutions are mentioned in official AWS documentation for processing mirrored traffic right now: Zeek and Suricata.
In this article, we’ll use the Suricata solution for demo purposes. The Zeek configuration is quite similar.
Zeek or Suricata capture mirrored traffic flows and log them based on configured rules. The Filebeats logs shipper sends logged information to the Elasticsearch instance or cluster.
To deploy the Suricata EC2 instance, you must apply the 7_suricata module from our demo repository.
During the bootstrap, the Suricata EC2 instance will install the Suricata Docker container built from scratch. We slightly modified the original solution to use the Amazon OpenSerach (Elasticsearch) service instead of keeping the ELK stack on the Suricata instance to make it lighter.
Here’s how the Suricata EC2 instance is designed:
Enabling Traffic Mirroring
As soon as we set up the infrastructure for traffic analysis, we can enable Traffic Mirroring from the Demo EC2 instance to the Suricata EC2 instance.
To enable Traffic Mirroring, you must deploy the 7_suricata Terraform module from our demo repository.
This module will mirror all HTTPS traffic from the Demo EC2 to the Suricata EC2 instance.
Windows Jumpbox
Finally, to access to ElasticSearch Kibana dashboard (URL provided in the 6_elk_stack Terraform module output), we need to deploy the Windows Jumpbox EC2 instance.
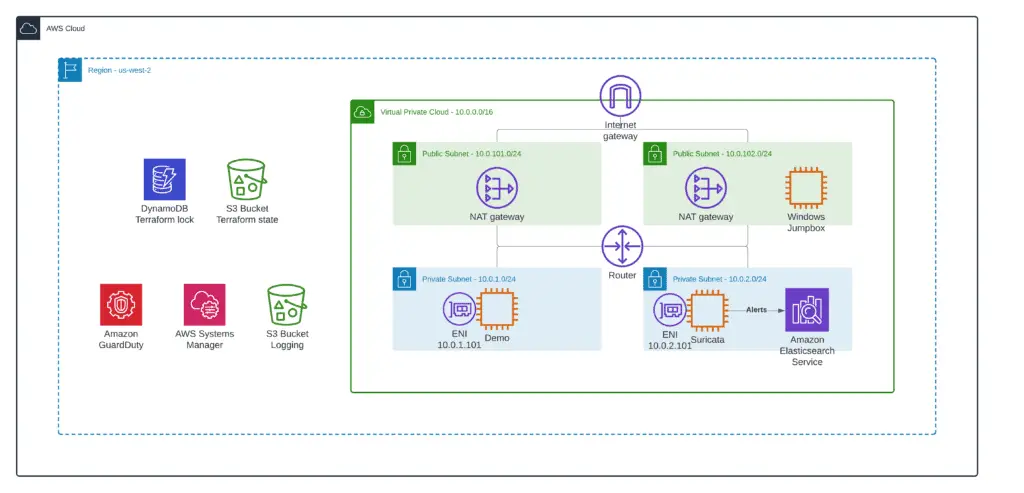
Note: you need to provide your own SSH Key Name value to deploy this module successfully.
Deploy the 9_windows_jumpbox Terraform module, which will run Windows EC2 and automatically install Google Chrome using Chocolatey.
Kibana initial configuration
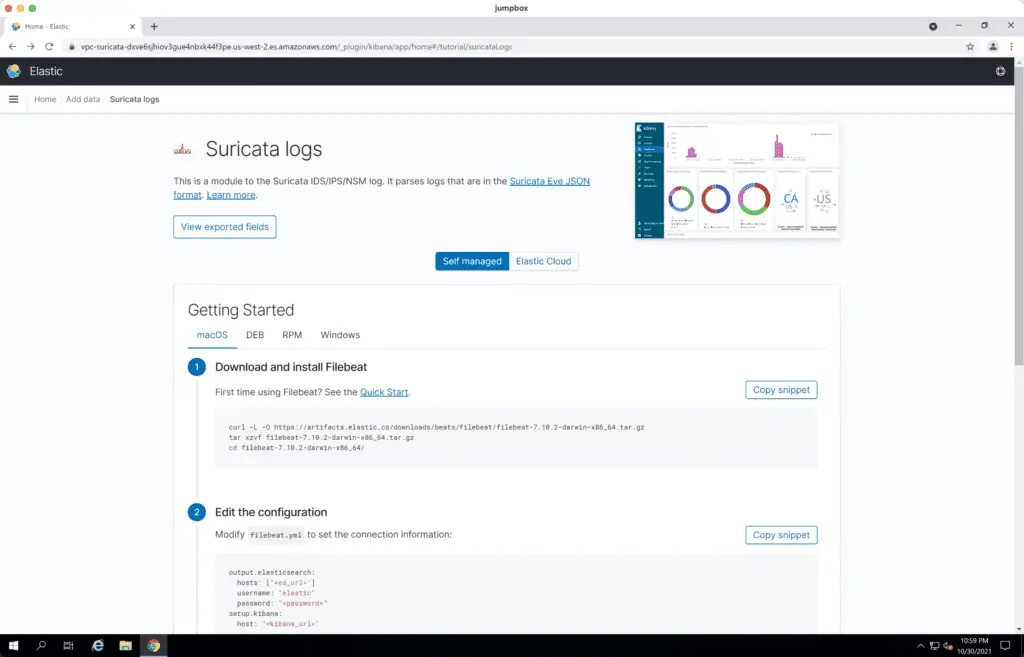
Log in to your Windows JumpHost, open the Kibana dashboard using Google Chrome (URL provided in the 6_elk_stack Terraform module output), and hit Add data button.

Click on the Suricata logs module:

Scroll down the page and hit Create button.
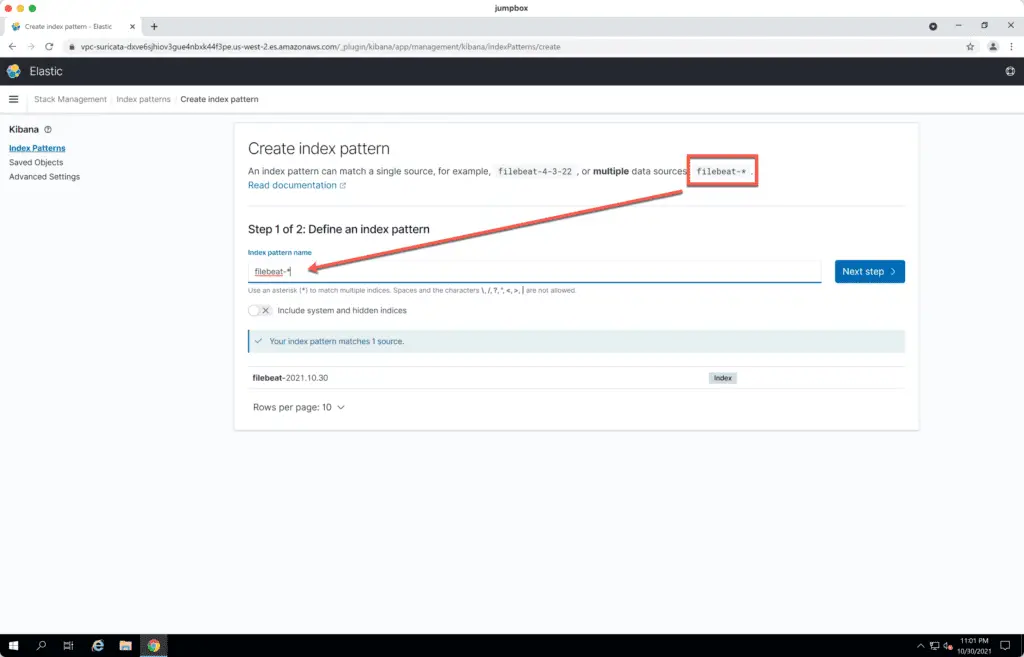
Hit Create index pattern button:

Put filebeat-* to the Index pattern name field. Hit the Next step button.
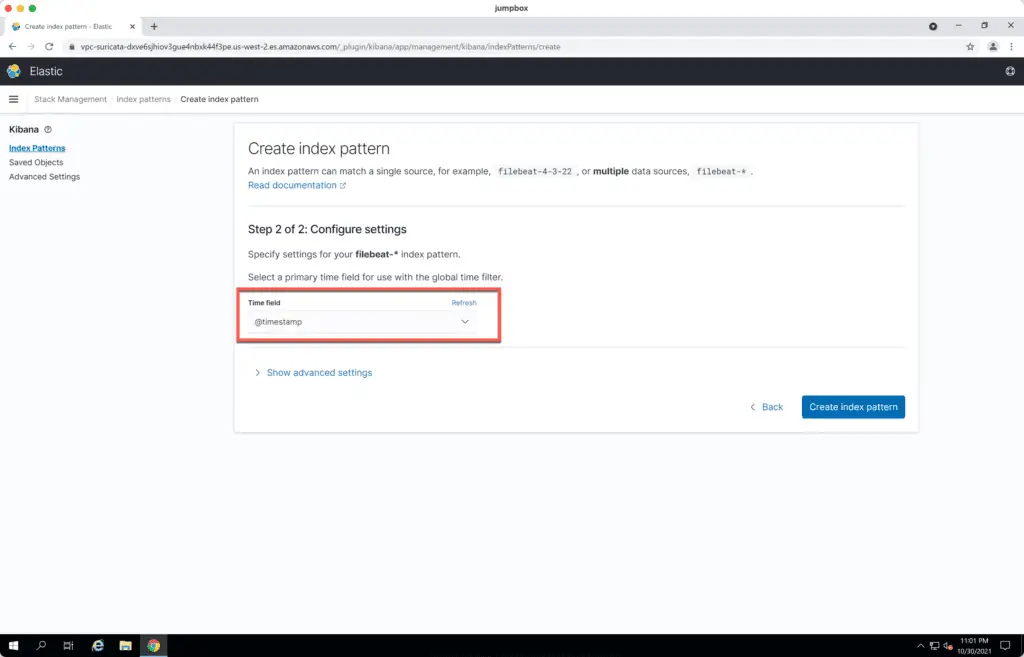
Specify @timestamp as the Time field and hit the Create index pattern button.
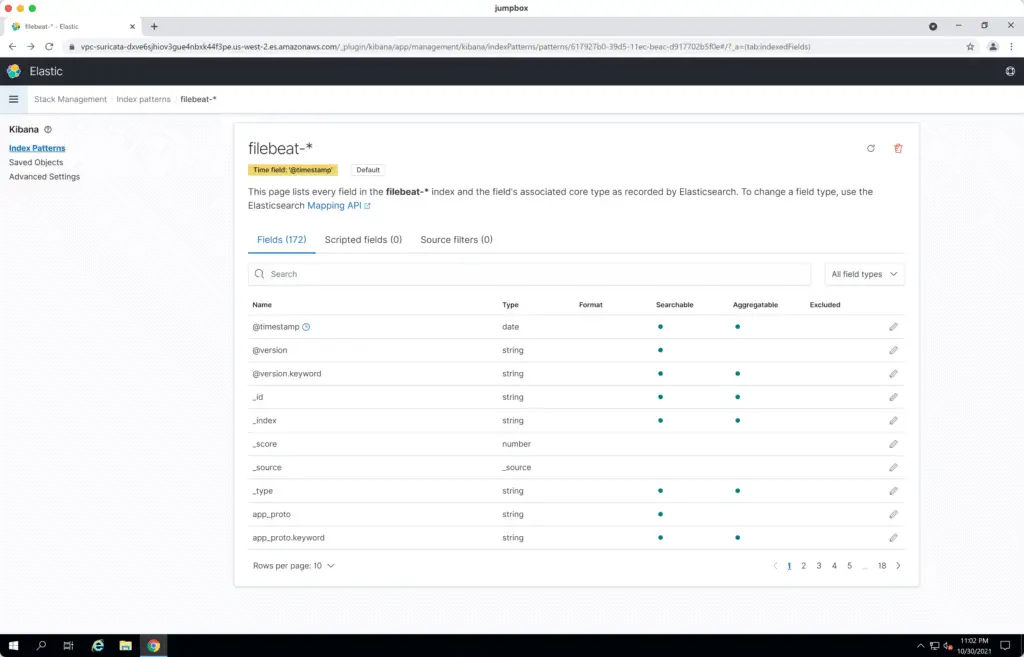
You’ll see a successfully created Elasticsearch Index pattern for Suricata logs:
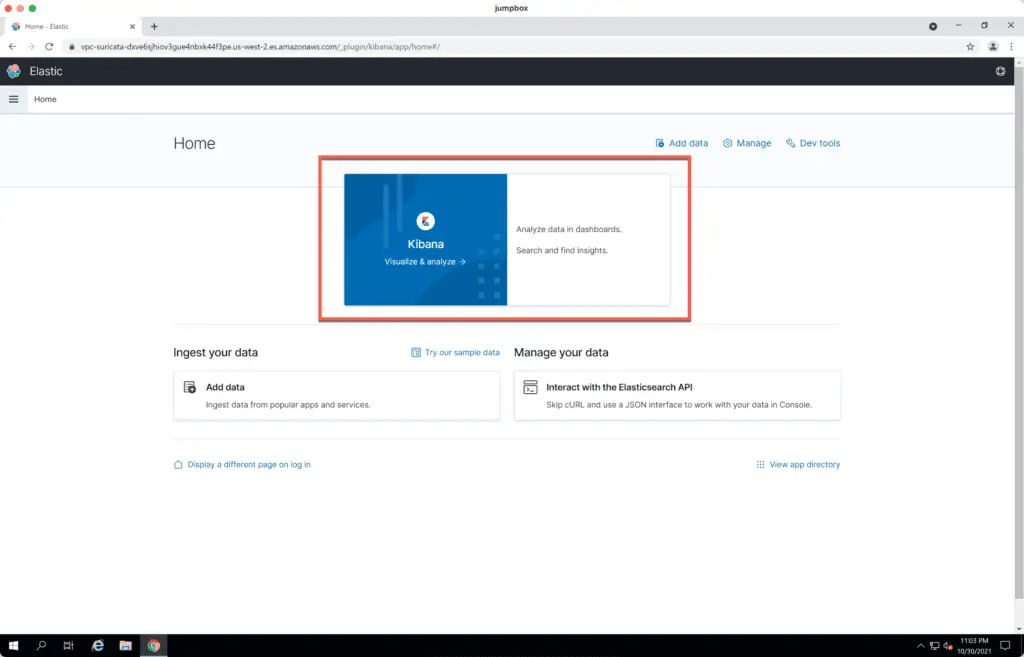
Return to the Kibana homepage and click on the Kibana widget:
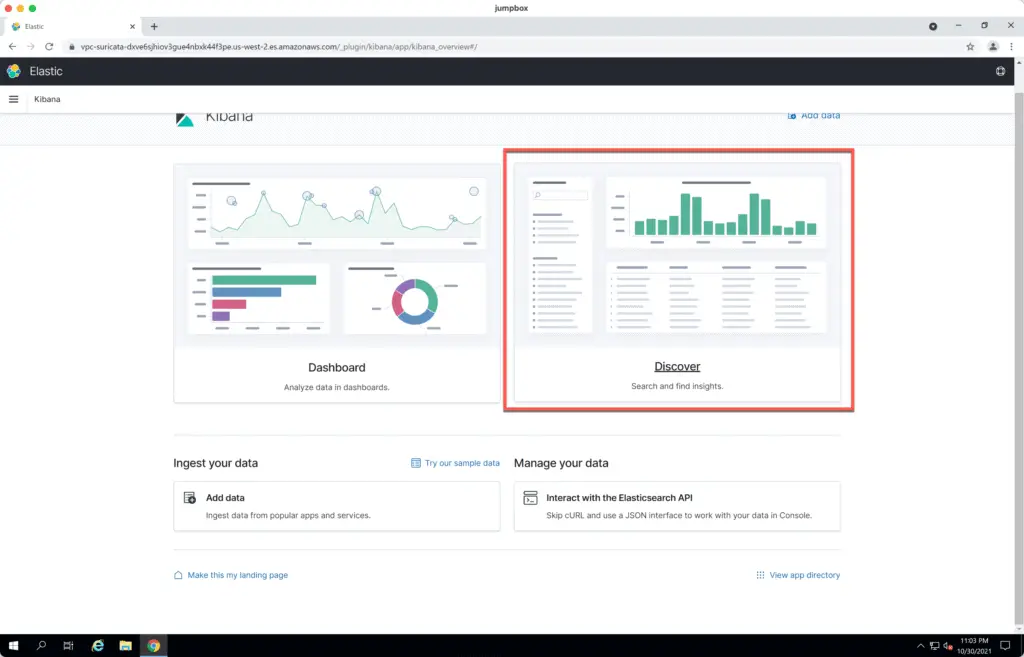
Click on the Discover widget:
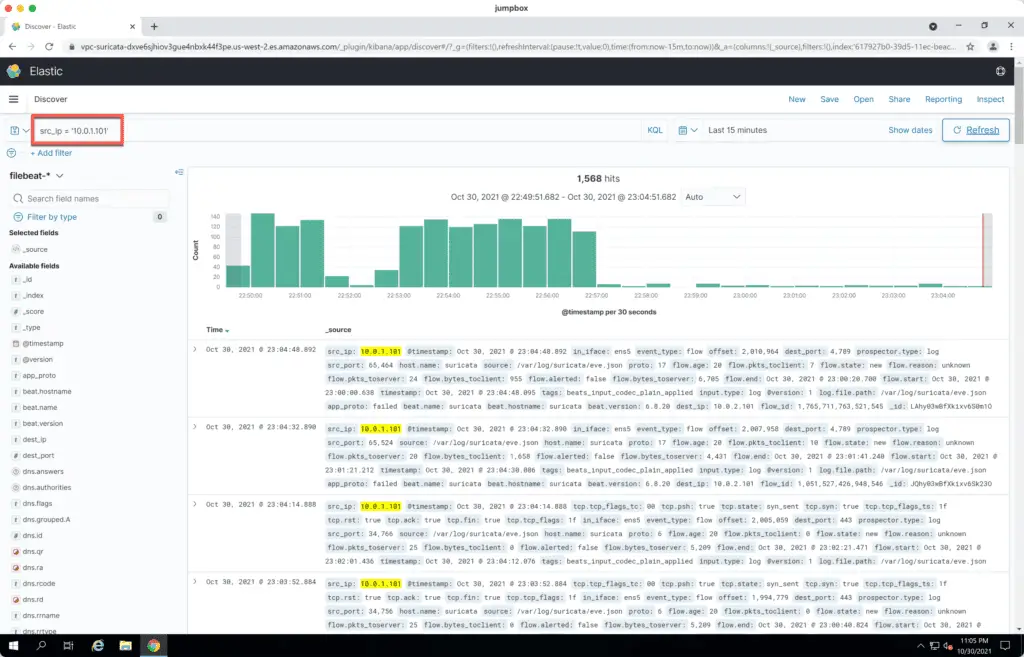
In the Search field type src_ip = '10.0.1.101' to get Suricata traffic events captured from the Demo EC2 instance:
Amazon GuardDuty
Amazon GuardDuty uses ML (Machine Learning), Anomaly Detection, and Integrated Threat Intelligence to identify threats in your environment. It accomplishes this by analyzing log data from your environment. Coming full circle, GuardDuty can use VPC Flow Logs data to examine what it believes to be “normal” traffic flows. Any anomalies can be flagged for review or have an action created against them with either CloudWatch or Lambda.
We enabled Amazon GuardDuty when we deployed our demo VPC using the 1_base_infrastructure Terraform module.
GuardDuty automatically checks S3 bucket data for the VPC Flow Logs data, analyzes it, and generates alerts.
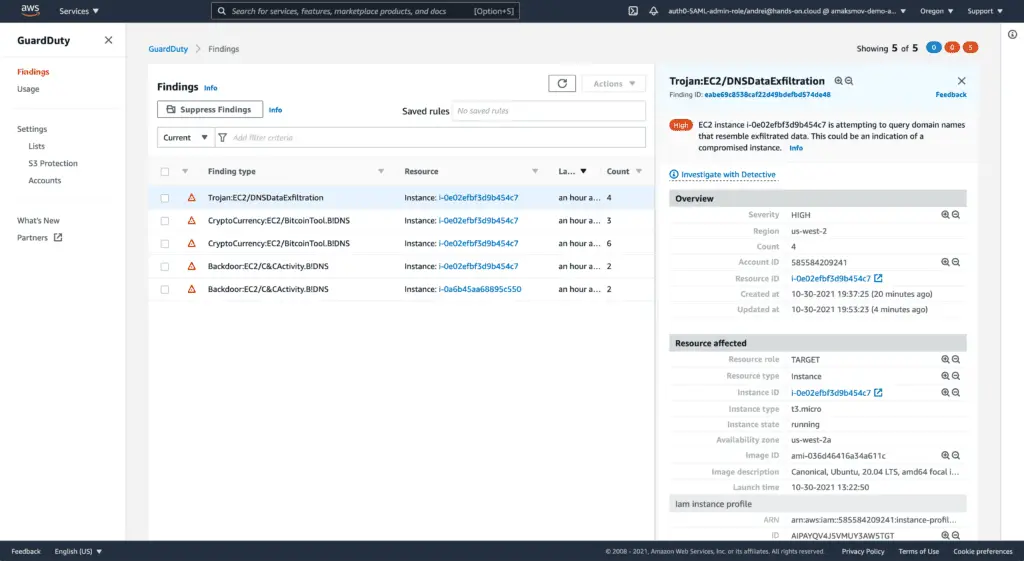
You can test GuardDuty by executing the following command from our Demo EC2 instance:
dig GuardDutyC2ActivityB.com anyThe above DNS query command to a known fake domain generates aGuardDuty finding:
You may find some additional GuardDuty tests in the amazon-guardduty-tester repository.
Another interesting use-case of using GuardDuty is enabling automatic Traffic Mirroring from the instances that generated the GuardDuty events to your traffic network analysis platform.
Check out the VPC Traffic Mirroring Source Automation Application GitHub repository for more information.
Summary
This article covered automating traffic inspection and monitoring for AWS VPCs, Subnets, and Network Interfaces using VPC Flow Logs, Traffic Mirroring, Amazon Athena, OpenSearch (Elasticsearch), Suricata, and Guard Duty deployed by the Terraform.
