AWS Observability: AWS Cloud Monitoring Best Practices
Achieve comprehensive visibility and efficient monitoring of your AWS environment with AWS observability. In this article, we explore the importance of AWS observability and provide best practices for effective monitoring and troubleshooting. Discover the key AWS services such as CloudWatch, X-Ray, CloudTrail, and Config that enable you to gain deep insights into your infrastructure, applications, and logs. We also discuss integrating third-party tools like Splunk, DataDog, and popular middleware solutions such as New Relic, Dynatrace, and AppDynamics to enhance your observability capabilities further. Improve your AWS resources’ performance, reliability, and security through AWS observability.
Introduction to AWS Observability
In today’s cloud-centric world, where organizations rely heavily on AWS infrastructure to power their applications and services, it has become crucial to ensure comprehensive visibility into the performance and health of the cloud environment. This is where AWS observability comes into play.
AWS observability refers to gaining insights into the behavior and performance of your AWS resources, applications, and services. It involves collecting, analyzing, and visualizing data from various sources to monitor, troubleshoot, and optimize the overall system.
Traditionally, monitoring has focused on CPU utilization, network traffic, and storage utilization metrics. While these metrics still play a vital role, AWS observability takes monitoring further by incorporating other essential aspects such as logging, tracing, and auditing. This holistic approach provides a more comprehensive understanding of your AWS infrastructure and applications, allowing you to identify and resolve issues quickly, optimize resource utilization, and enhance overall performance.
By leveraging AWS observability, you can proactively detect and troubleshoot issues, understand the impact of changes or deployments, and gain valuable insights into the performance of your applications and services. It empowers you to make data-driven decisions, improve operational efficiency, and ensure a seamless user experience.
This blog post will explore the best practices for AWS Cloud Monitoring and explore the various AWS services and tools that enable effective observability. From AWS CloudWatch, which offers a wide range of monitoring capabilities, to AWS X-Ray for tracing and debugging, and AWS ServiceLens for visualizing application health, we will cover the key components of AWS observability. We will also discuss important considerations and strategies for optimizing your monitoring setup and achieving cost efficiency.
So, whether you are just starting with AWS observability or looking to enhance your existing monitoring practices, this blog post will serve as a comprehensive guide to help you effectively leverage AWS’s observability offerings. Let’s dive in and explore the world of AWS Cloud Monitoring best practices.
Importance of AWS Cloud Monitoring
Effective monitoring of your AWS infrastructure is crucial for several reasons. Let’s explore the key reasons why AWS Cloud Monitoring is of utmost importance:
Proactive Issue Detection and Resolution
AWS Cloud Monitoring lets you proactively detect issues and anomalies in your infrastructure and applications. By monitoring various metrics, logs, and events, you can set up alerts and notifications to be instantly notified when something goes wrong or deviates from the expected behavior. This proactive approach enables you to identify and address potential problems before they impact your application performance, availability, or security, ensuring a seamless user experience.
Performance Optimization and Capacity Planning
Monitoring your AWS resources and services provides valuable performance and usage patterns insights. With this data, you can identify bottlenecks, optimize resource allocation, and ensure optimal performance. Cloud Monitoring helps you understand resource utilization trends, predict future demands, and plan for capacity scaling or optimization. You can fine-tune your infrastructure by monitoring key performance indicators, improving efficiency, and saving costs.
Enhanced Security and Compliance
Security is a top concern for any organization leveraging AWS. Monitoring your AWS environment enables you to detect security threats, unauthorized access attempts, and suspicious activities. By monitoring logs and events, you can identify potential security breaches, investigate incidents, and take timely actions to mitigate risks. Additionally, AWS Cloud Monitoring helps you meet compliance requirements by providing the necessary data for auditing and reporting purposes.
Application Performance and User Experience
The performance of your applications directly impacts user experience, customer satisfaction, and business success. AWS Cloud Monitoring allows you to monitor key application metrics, such as response times, error rates, and latency, to gain insights into the performance of your applications. By identifying performance bottlenecks and areas for improvement, you can optimize your applications, deliver a smooth user experience, and maintain high levels of customer satisfaction.
Check out the Serverless Monitoring Solutions For Your Applications article for additional information on the topic.
Operational Efficiency and Cost Optimization
Monitoring your AWS environment helps improve operational efficiency and cost optimization. By monitoring resource utilization, you can identify underutilized or idle resources and take action to optimize their usage. Additionally, monitoring cost-related metrics enables you to identify areas of potential cost savings or cost overruns. By having visibility into your AWS spending patterns, you can make informed decisions, right-size your resources, and optimize your cloud costs.
In summary, AWS Cloud Monitoring ensures your AWS infrastructure and applications’ performance, security, and cost-effectiveness. It enables proactive issue detection, performance optimization, enhanced security, improved user experience, operational efficiency, and cost optimization. By investing in effective AWS Cloud Monitoring practices, you can achieve greater operational excellence and maximize the value of your AWS resources.
AWS CloudWatch: Key Monitoring Service
Regarding AWS Cloud Monitoring, one of the most prominent and comprehensive services offered by AWS is CloudWatch. CloudWatch provides a centralized platform for monitoring and managing various aspects of your AWS resources, applications, and services.

Image credits: Digital Cloud training
Let’s explore the key components of CloudWatch that contribute to AWS observability:
CloudWatch Metrics
CloudWatch Metrics lets you collect and monitor various metrics from your AWS resources and applications in real-time. These metrics include CPU utilization, network traffic, disk usage, and custom application-specific metrics. CloudWatch Metrics provides essential insights into your resources’ health, performance, and behavior. You can visualize these metrics on CloudWatch dashboards, set up alarms based on thresholds, and trigger automated actions when specific conditions are met.
CloudWatch Alarms
CloudWatch Alarms allow you to set up thresholds and trigger actions based on specific metric conditions. You can define alarms to notify you via email, SMS, or other mechanisms when a metric breaches a threshold. For example, you can create an alarm to notify you when CPU utilization exceeds a certain percentage or when the number of HTTP 500 errors crosses a predefined threshold. CloudWatch Alarms help you proactively detect and respond to critical events, ensuring the availability and performance of your AWS resources and applications.
CloudWatch Logs
CloudWatch Logs enable you to capture, store, and analyze log files generated by your AWS resources and applications. You can collect logs from various sources, such as EC2 instances, Lambda functions, and application containers. CloudWatch Logs provide a centralized and scalable log management solution, allowing you to gain insights into system behavior, troubleshoot issues, and perform real-time log analysis. You can set up filter patterns and create metric filters to extract specific information from logs and generate metrics for monitoring purposes.
CloudWatch Dashboards
CloudWatch Dashboards provide a customizable and visual representation of your AWS resource metrics and alarms. You can create personalized dashboards to monitor the health and performance of your resources in real time. Dashboards allow you to aggregate and visualize metrics, alarms, and logs in a single pane of glass, providing a comprehensive overview of your AWS environment. With CloudWatch Dashboards, you can easily track key performance indicators, identify trends, and make data-driven decisions to optimize your AWS infrastructure.
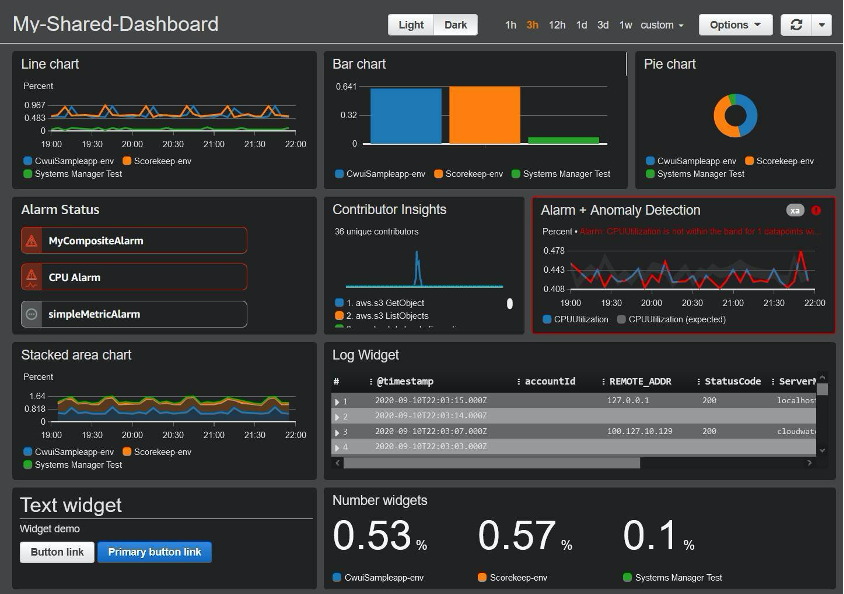
CloudWatch is a powerful monitoring service that forms the backbone of AWS observability. It offers many features and capabilities to monitor, analyze, and manage your AWS resources effectively. By leveraging CloudWatch Metrics, Alarms, Logs, and Dashboards, you can gain deep visibility into your infrastructure, troubleshoot issues, and optimize the performance and availability of your AWS environment.
In the next sections, we will explore additional AWS observability services such as AWS X-Ray, AWS CloudTrail, and AWS Config, which complement CloudWatch and provide further insights into your applications, tracing auditing, and configuration management.
AWS X-Ray: Tracing and Debugging
When it comes to gaining visibility into the behavior and performance of your distributed applications, AWS X-Ray emerges as a powerful service for tracing and debugging. It allows you to understand how requests flow through your applications, identify bottlenecks, and pinpoint areas that require optimization. Let’s explore the key AWS X-Ray features and benefits:
Distributed Tracing
AWS X-Ray facilitates distributed tracing, which helps you visualize and analyze the flow of requests across various services and components of your application architecture. It provides end-to-end tracing capabilities, allowing you to track a request’s journey as it traverses different AWS resources, microservices, and external dependencies. With distributed tracing, you can gain insights into latency, identify performance issues, and understand each component’s impact on your applications’ overall response time.

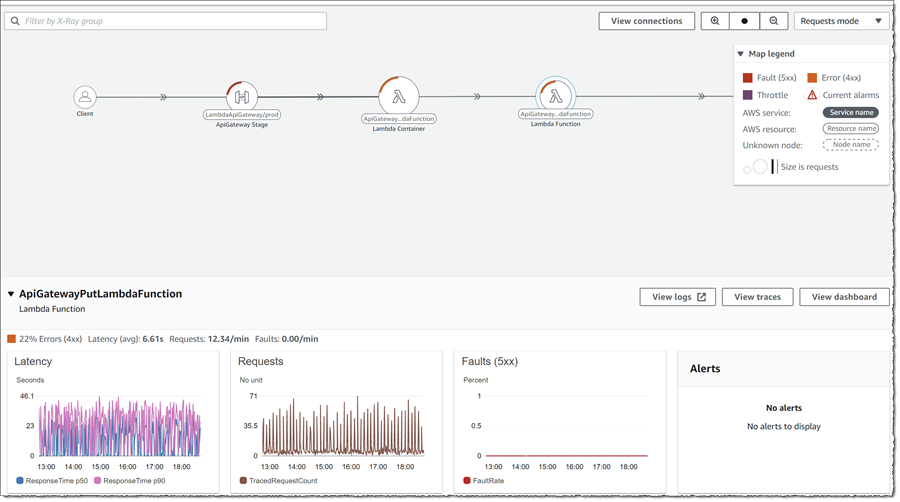
Service Maps
AWS X-Ray generates service maps that visually represent the interactions between different services in your application. These service maps illustrate the dependencies and relationships among components, making identifying critical paths and bottlenecks easier. Service maps offer a high-level view of your application’s architecture, helping you understand the complexity and visualize how services interact.
Performance Insights
AWS X-Ray provides detailed performance insights, allowing you to analyze the behavior of individual components within your application. You can identify the slowest components, database queries, or API calls contributing to increased latency. By understanding the performance characteristics of your application, you can optimize critical sections, improve response times, and enhance the overall user experience.

Error Analysis and Debugging
In addition to performance insights, AWS X-Ray helps you with error analysis and debugging. It captures and displays errors and exceptions encountered during the request processing, providing detailed information about the root cause. With this information, you can quickly identify and troubleshoot issues, reducing the mean time to resolution (MTTR) for incidents. AWS X-Ray also integrates with other AWS services like AWS CloudWatch and AWS Lambda to correlate error logs and metrics, making identifying patterns and diagnosing problems easier.
Integration with AWS Services and SDKs
AWS X-Ray integrates with various AWS services and software development kits (SDKs). You can enable X-Ray tracing for AWS Lambda functions, Amazon EC2 instances, and other services by simply enabling the X-Ray integration. It also provides SDKs for popular programming languages, making it easy to instrument your applications and capture tracing data without significant code changes.
In summary, AWS X-Ray empowers you to trace, analyze, and debug your distributed applications, providing insights into performance bottlenecks, latency issues, and error conditions. By leveraging its distributed tracing capabilities, service maps, performance insights, and error analysis features, you can optimize your application’s performance, improve troubleshooting efficiency, and deliver a better user experience.
In the next sections, we will explore additional AWS observability services like AWS CloudTrail and AWS Config, focusing on your AWS environment’s auditing, compliance, and configuration management aspects.
AWS CloudTrail: Auditing and Compliance
Maintaining proper auditing and compliance practices is crucial for organizations leveraging AWS services. AWS CloudTrail is a service that enables you to monitor and record activity within your AWS infrastructure, ensuring visibility into API actions, resource changes, and user activity. Let’s delve into the key features and benefits of AWS CloudTrail:
Activity Logging
AWS CloudTrail captures detailed logs of API calls made within your AWS account. It records information such as the caller’s identity, the time of the API call, the action performed, and the affected resource. These logs provide a comprehensive audit trail, allowing you to track changes, investigate security incidents, and comply with regulatory requirements.
Resource-Level Changes
In addition to API calls, AWS CloudTrail tracks and logs resource-level changes. This includes modifications to security groups, IAM policies, S3 bucket configurations, and more. By monitoring these changes, you can gain visibility into who made the modifications and when, enabling you to identify unauthorized or unintended modifications and take appropriate actions.
Integration with AWS Services
AWS CloudTrail seamlessly integrates with other AWS services, enhancing the scope of its auditing capabilities. It can capture AWS Lambda, Amazon S3, Amazon RDS, and AWS CloudFormation activity logs. This integration gives you a comprehensive view of activities across various AWS services, providing a holistic approach to auditing and compliance.
Security Analysis and Threat Detection
By analyzing AWS CloudTrail logs, you can detect potential security threats and suspicious activities. Anomalous patterns, such as unusual API calls or unexpected resource modifications, can indicate security breaches or unauthorized access attempts. By leveraging AWS CloudTrail logs with other security analysis tools, you can strengthen your security posture and respond effectively to security incidents.
Compliance and Governance
AWS CloudTrail supports compliance and governance requirements by providing the necessary data for audits and regulatory reporting. The detailed logs captured by CloudTrail can be used to demonstrate compliance with industry standards and regulations, such as the General Data Protection Regulation (GDPR) or the Health Insurance Portability and Accountability Act (HIPAA). These logs are crucial evidence for proving adherence to security policies and regulatory obligations.
Log Management and Analysis
AWS CloudTrail logs can be stored in Amazon S3 or delivered to Amazon CloudWatch Logs for further analysis and retention. By leveraging CloudWatch Logs, you can perform real-time analysis, create custom metrics and dashboards, and set up alerts based on specific log events. This enables you to automate monitoring and receive notifications when critical events occur, ensuring timely responses to potential security or compliance issues.
In summary, AWS CloudTrail is vital in auditing and compliance within your AWS environment. By capturing and analyzing activity logs, tracking resource-level changes, and integrating with other AWS services, CloudTrail enables you to maintain a robust auditing framework, detect security threats, and comply with regulatory requirements. Leveraging AWS CloudTrail as part of your overall AWS observability strategy enhances your ability to maintain a secure and compliant infrastructure.
Next, we will explore AWS Config, which focuses on configuration management and helps you maintain a consistent and compliant state of your AWS resources.
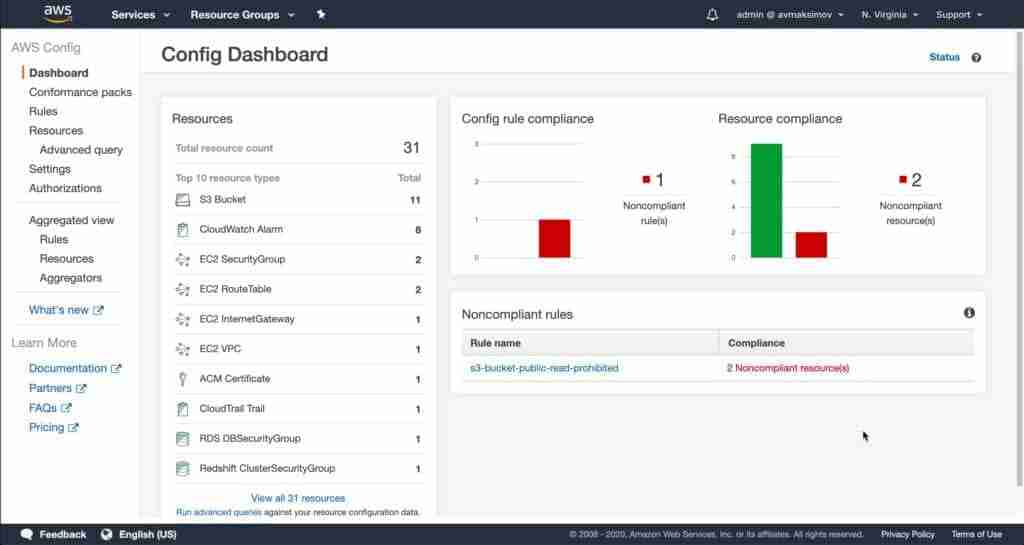
AWS Config: Configuration Management
Managing the configuration of your AWS resources is essential to ensure consistency, compliance, and security. AWS Config is a powerful service that provides configuration management capabilities, enabling you to assess, audit, and evaluate the configurations of your AWS resources.
Let’s explore the key features and benefits of AWS Config:
Resource Configuration Tracking
AWS Config continuously monitors and records the configuration details of your AWS resources. It captures a snapshot of resource configurations and tracks any changes over time. This includes information such as resource attributes, relationships, and configurations. By maintaining a historical record of resource configurations, AWS Config allows you to assess the state of your resources at any point in time and track configuration changes over time.
Configuration Compliance and Governance
AWS Config enables you to define and enforce configuration rules to ensure compliance with security policies, industry regulations, and best practices. You can define custom rules or leverage pre-configured rulesets provided by AWS. These rules evaluate the configurations of your resources against specified criteria, helping you identify non-compliant resources and take corrective actions. With AWS Config, you can maintain a consistent and compliant state of your resources across your AWS environment.
Configuration Auditing and Change Management
AWS Config provides comprehensive auditing and change management capabilities. It allows you to view detailed configuration change history, including the user or application that made the change, the time of the change, and the previous and current configurations. This auditing capability facilitates accountability and helps you understand who made specific changes to your resources. By analyzing the change history, you can troubleshoot issues, identify unauthorized modifications, and validate the impact of configuration changes.
Configuration Drift Detection
Configuration drift occurs when the actual configuration of a resource deviates from its intended configuration. AWS Config helps you detect configuration drift by comparing the current configuration of a resource against its recorded configuration. It alerts you when inconsistencies are detected, allowing you to take corrective actions and ensure your resources remain desired. Configuration drift detection is crucial for maintaining security, compliance, and consistency across your AWS environment.
Integration with AWS Services and AWS Config Rules
AWS Config integrates with various AWS services, allowing you to monitor and manage the configurations of a wide range of resources. It supports integration with services such as Amazon EC2, Amazon S3, AWS Lambda, AWS CloudFormation, and more. Additionally, AWS Config provides a rules engine that allows you to define custom rules or use pre-configured rules to evaluate resource configurations. These rules enable you to enforce best practices, security standards, and compliance requirements specific to your organization.
In summary, AWS Config provides powerful configuration management capabilities that help you maintain consistency, compliance, and security across your AWS resources. By tracking resource configurations, enforcing compliance rules, auditing changes, detecting configuration drift, and integrating with other AWS services, AWS Config ensures that your resources are properly configured and adhere to your organization’s policies and standards.
In the next sections, we will explore additional AWS observability services and best practices to enhance your AWS monitoring and observability strategy further.
AWS ServiceLens: Visualizing Application Health
Understanding the health and performance of your applications is critical for maintaining optimal user experiences. AWS ServiceLens is a powerful service that provides a holistic view of your application’s health and performance by aggregating and visualizing data from multiple AWS services.
Let’s explore the key features and benefits of AWS ServiceLens:
Application Dashboard
AWS ServiceLens offers a centralized application dashboard that consolidates key performance metrics and health indicators from various AWS services. This dashboard provides a real-time view of your application’s health, including resource utilization, latency, error rates, etc. With this comprehensive overview, you can quickly identify bottlenecks, performance issues, and areas that require optimization, enabling you to take proactive measures to ensure a smooth application experience.
Service Maps and Dependency Analysis
ServiceLens generates service maps that illustrate the dependencies between different components of your application architecture. These maps help you understand the flow of requests and the interactions between services. By visualizing the dependencies, you can identify potential points of failure, bottlenecks, and areas for optimization. ServiceLens also provides dependency analysis, allowing you to drill down into individual services to gain deeper insights into their performance and behavior.
End-to-End Tracing
AWS ServiceLens facilitates the end-to-end tracing of requests as they traverse your application’s components and services. By capturing and analyzing tracing data, you can identify the path and latency of each request, enabling you to pinpoint performance bottlenecks and optimize critical sections of your application. End-to-end tracing helps you understand each service’s impact on your application’s overall performance, facilitating troubleshooting and performance optimization efforts.
Anomaly Detection and Insights
ServiceLens leverages machine learning algorithms to detect anomalies and provide actionable insights into your application’s health and performance. It automatically identifies unusual behavior, unexpected resource utilization, and deviations from normal patterns. By proactively detecting anomalies, you can address issues before they impact your application’s performance and user experience. ServiceLens provides insights and recommendations to help you optimize resource allocation, improve efficiency, and enhance overall application performance.
Integration with AWS X-Ray and CloudWatch
AWS ServiceLens integrates seamlessly with AWS X-Ray and CloudWatch, enhancing its capabilities and providing a comprehensive observability solution. By combining the tracing and debugging capabilities of AWS X-Ray with the monitoring and alerting features of CloudWatch, ServiceLens offers a unified view of your application’s health and performance. This integration lets you correlate data from multiple sources, gain deeper insights, and streamline troubleshooting and optimization efforts.
In summary, AWS ServiceLens empowers you to visualize and monitor the health and performance of your applications in a centralized and comprehensive manner. By leveraging its application dashboard, service maps, end-to-end tracing, anomaly detection, and integration with AWS X-Ray and CloudWatch, you can gain deep visibility into your application’s behavior, optimize performance, and deliver exceptional user experiences.
The next sections will explore additional best practices and tools to enhance AWS observability. These include AWS CloudFormation for infrastructure as code and AWS Elastic Beanstalk for simplified application deployment and management.
Best Practices for AWS Observability
To ensure effective observability of your AWS infrastructure and applications, following best practices that enable comprehensive monitoring, logging, and tracing is important. Here are some key best practices to consider:
Define Monitoring Goals
Before implementing monitoring solutions, clearly define your monitoring goals. Understand the key metrics and indicators crucial for your applications and infrastructure. Determine what constitutes normal behavior and establish thresholds for alerts and notifications. By having well-defined monitoring goals, you can focus on collecting and analyzing the most relevant data to drive actionable insights.
Design Effective Metrics and Alarms
Designing effective metrics and alarms is essential for proactive monitoring. Identify the right set of metrics that provide insights into your resources’ health, performance, and utilization. Define meaningful alarms based on these metrics to receive timely notifications when certain conditions are met or breached. Ensure that alarms are properly configured to minimize false positives and capture critical events accurately.
Centralized Logging and Log Analysis
Centralized logging is crucial for efficient log management and analysis. Consolidate logs from all your AWS services and applications into a centralized location such as Amazon CloudWatch Logs or Amazon Elasticsearch Service. This allows for easy searching, correlation, and analysis of log data. Implement log aggregation and retention strategies that align with your compliance and troubleshooting needs.
Distributed Tracing with AWS X-Ray
Utilize AWS X-Ray for distributed tracing to gain insights into the flow of requests across your application components. Instrument your applications to generate trace data and visualize service interactions and latencies. This helps identify performance bottlenecks, optimize resource allocation, and improve overall application response times.
Automate Monitoring with AWS CloudFormation
Leverage AWS CloudFormation to automate the deployment and configuration of your monitoring infrastructure. Define monitoring resources such as CloudWatch alarms, event rules, and metric filters as code using AWS CloudFormation templates. This enables consistent and repeatable monitoring setups, simplifies maintenance, and ensures that your monitoring configurations are version-controlled.
Monitoring Cost Optimization
Optimize your monitoring costs by carefully selecting the level of granularity and frequency for metrics and logs. Avoid over-provisioning monitoring resources and ensure you capture the necessary data without incurring unnecessary costs. Leverage features such as metric filters, log aggregation, and log retention policies to balance cost and visibility.
These best practices can establish a robust observability framework for your AWS environment. Monitoring goals, effective metrics and alarms, centralized logging, distributed tracing, automation with AWS CloudFormation, and cost optimization will help you gain deep insights, detect issues proactively, and ensure the smooth operation of your applications and infrastructure.
In the next section, we will explore AWS Elastic Beanstalk, a service that simplifies application deployment and management while providing built-in monitoring and logging capabilities.
AWS Observability with Third-Party Tools
While AWS provides a robust set of native observability services, several third-party tools can enhance your monitoring and observability capabilities in the AWS ecosystem. Let’s explore some popular third-party tools and their integration with AWS:
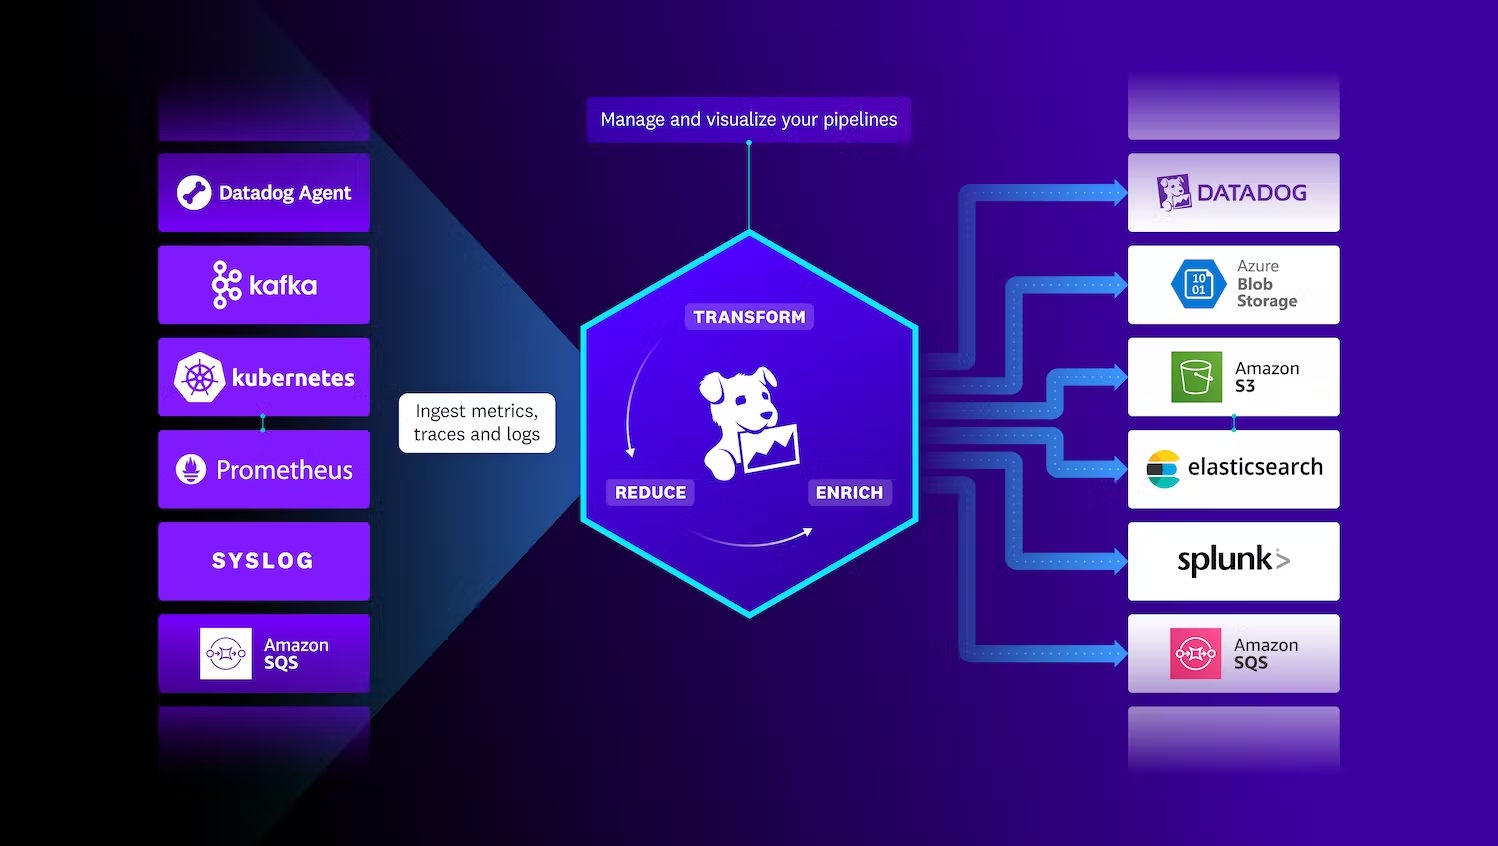
Middleware

Middleware: A unified observability platform for cloud-native, microservices and distributed apps
Middleware acts as the perfect agent for monitoring cloud infrastructure and applications. It specifically focuses on handling complex applications with multiple layers. It offers a complete management solution for the application layer and the underlying infrastructure.

ManageEngine

Manage Engine Applications Manager: AWS Monitoring
With ManageEngine Applications Manager’s AWS monitoring, you can have total visibility and control over your cloud resources and application workloads operating on your AWS environment. Improve performance and cut costs by quickly identifying problems, responding to business-critical warnings, and making the best use of resources.
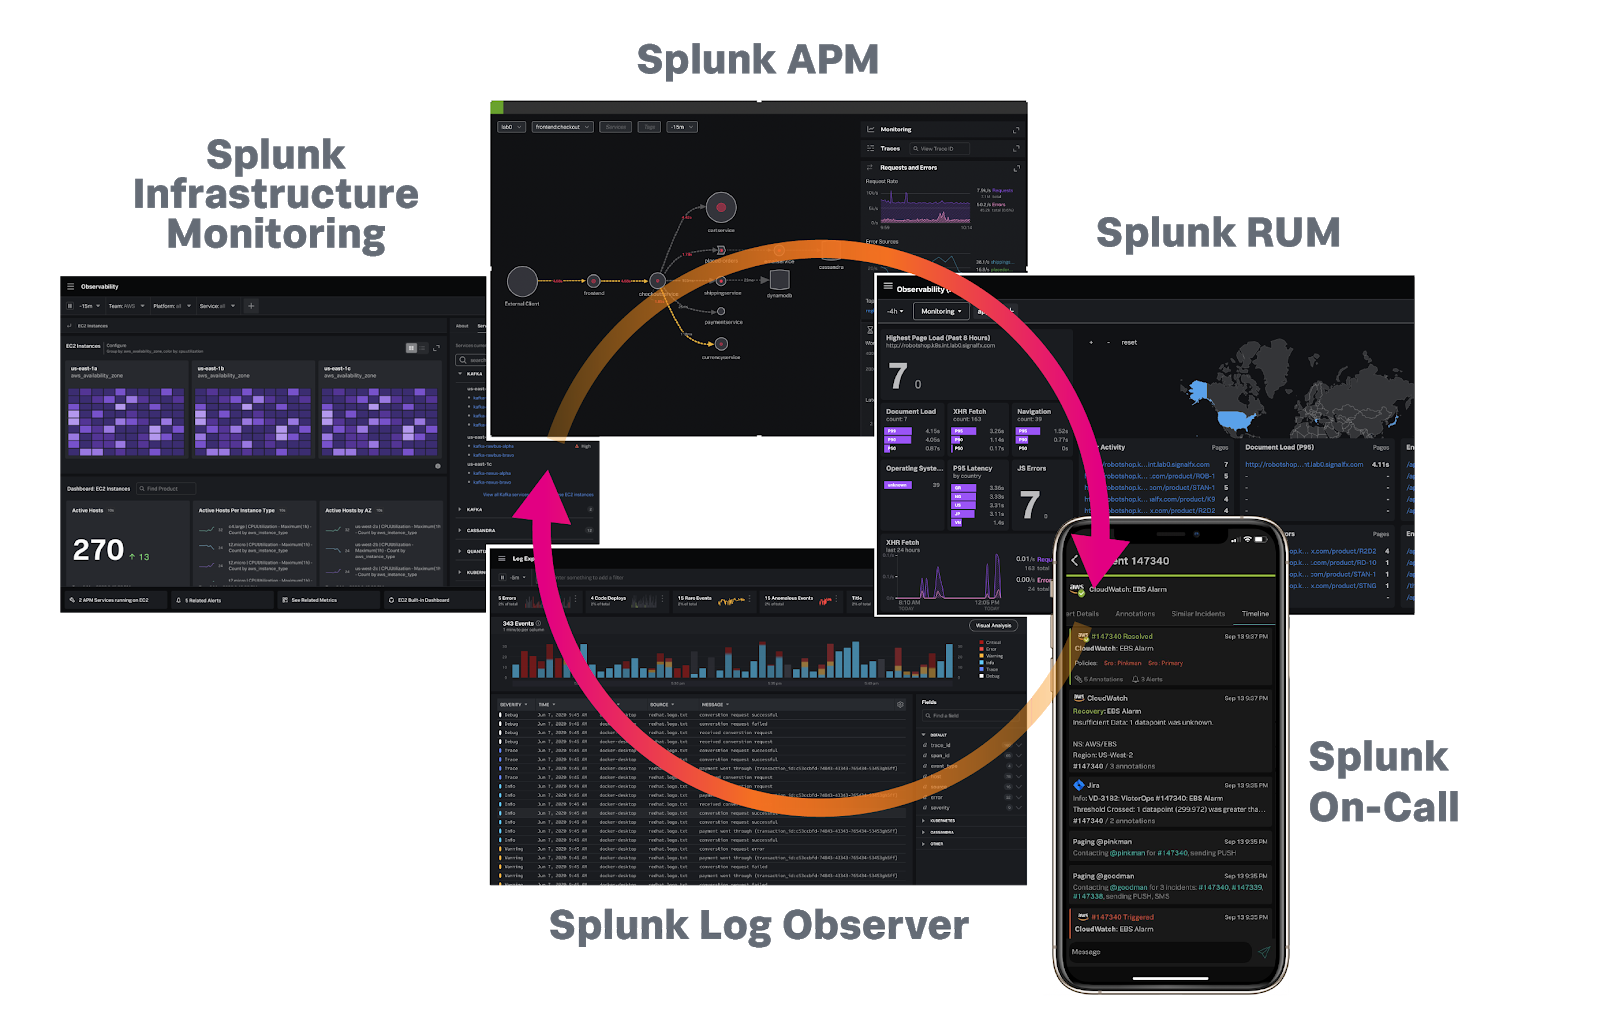
Splunk
Splunk is a popular data analytics and monitoring platform that can be integrated with AWS for enhanced observability. With Splunk, you can collect, analyze, and visualize data from various sources, including AWS CloudTrail logs, CloudWatch metrics, and VPC Flow Logs. Splunk offers powerful search capabilities, customizable dashboards, and machine learning-driven insights. By combining AWS data with other sources, Splunk enables you to correlate events and gain a comprehensive view of your AWS environment.
DataDog
DataDog is a cloud monitoring and observability platform that provides a unified view of your AWS infrastructure, applications, and logs. It offers real-time monitoring, distributed tracing, and log management capabilities. DataDog integrates seamlessly with AWS services, allowing you to collect and analyze metrics, traces, and logs from EC2 instances, Lambda functions, DynamoDB tables, and more. With DataDog, you can set up custom dashboards, create alerts, and leverage machine learning-based anomaly detection to optimize the performance of your AWS resources.
These are just a few examples of third-party tools that can complement your AWS observability strategy. Each tool has unique features and capabilities, allowing you to tailor your monitoring and observability setup based on your specific requirements and preferences. When considering third-party tools, evaluate their integration with AWS services, scalability, ease of use, and pricing models to ensure they align with your needs and budget.
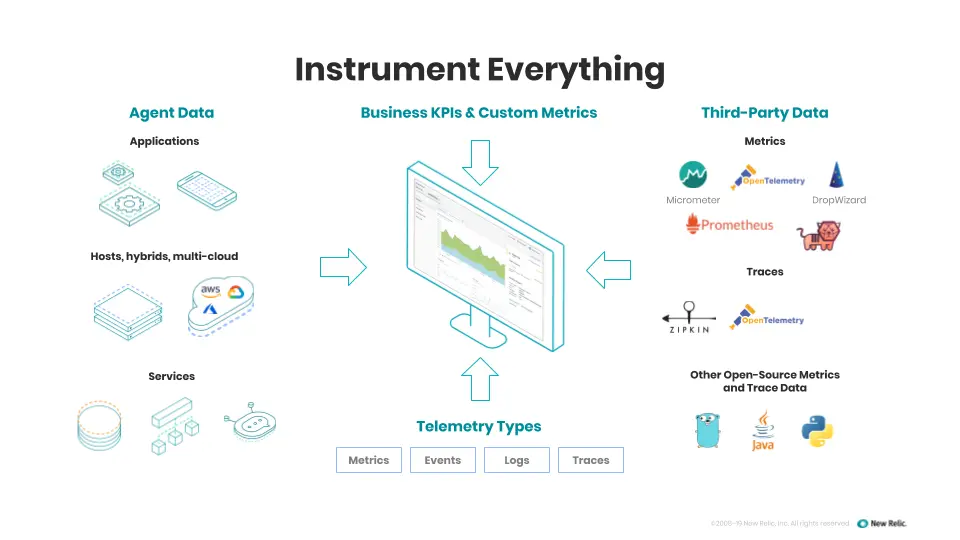
New Relic
New Relic is a comprehensive observability platform that provides end-to-end monitoring and troubleshooting capabilities for applications running on AWS. It offers real-time performance monitoring, distributed tracing, and error tracking, allowing you to identify bottlenecks, optimize resource utilization, and improve application performance. New Relic integrates with AWS services and provides out-of-the-box dashboards, alerts, and actionable insights.
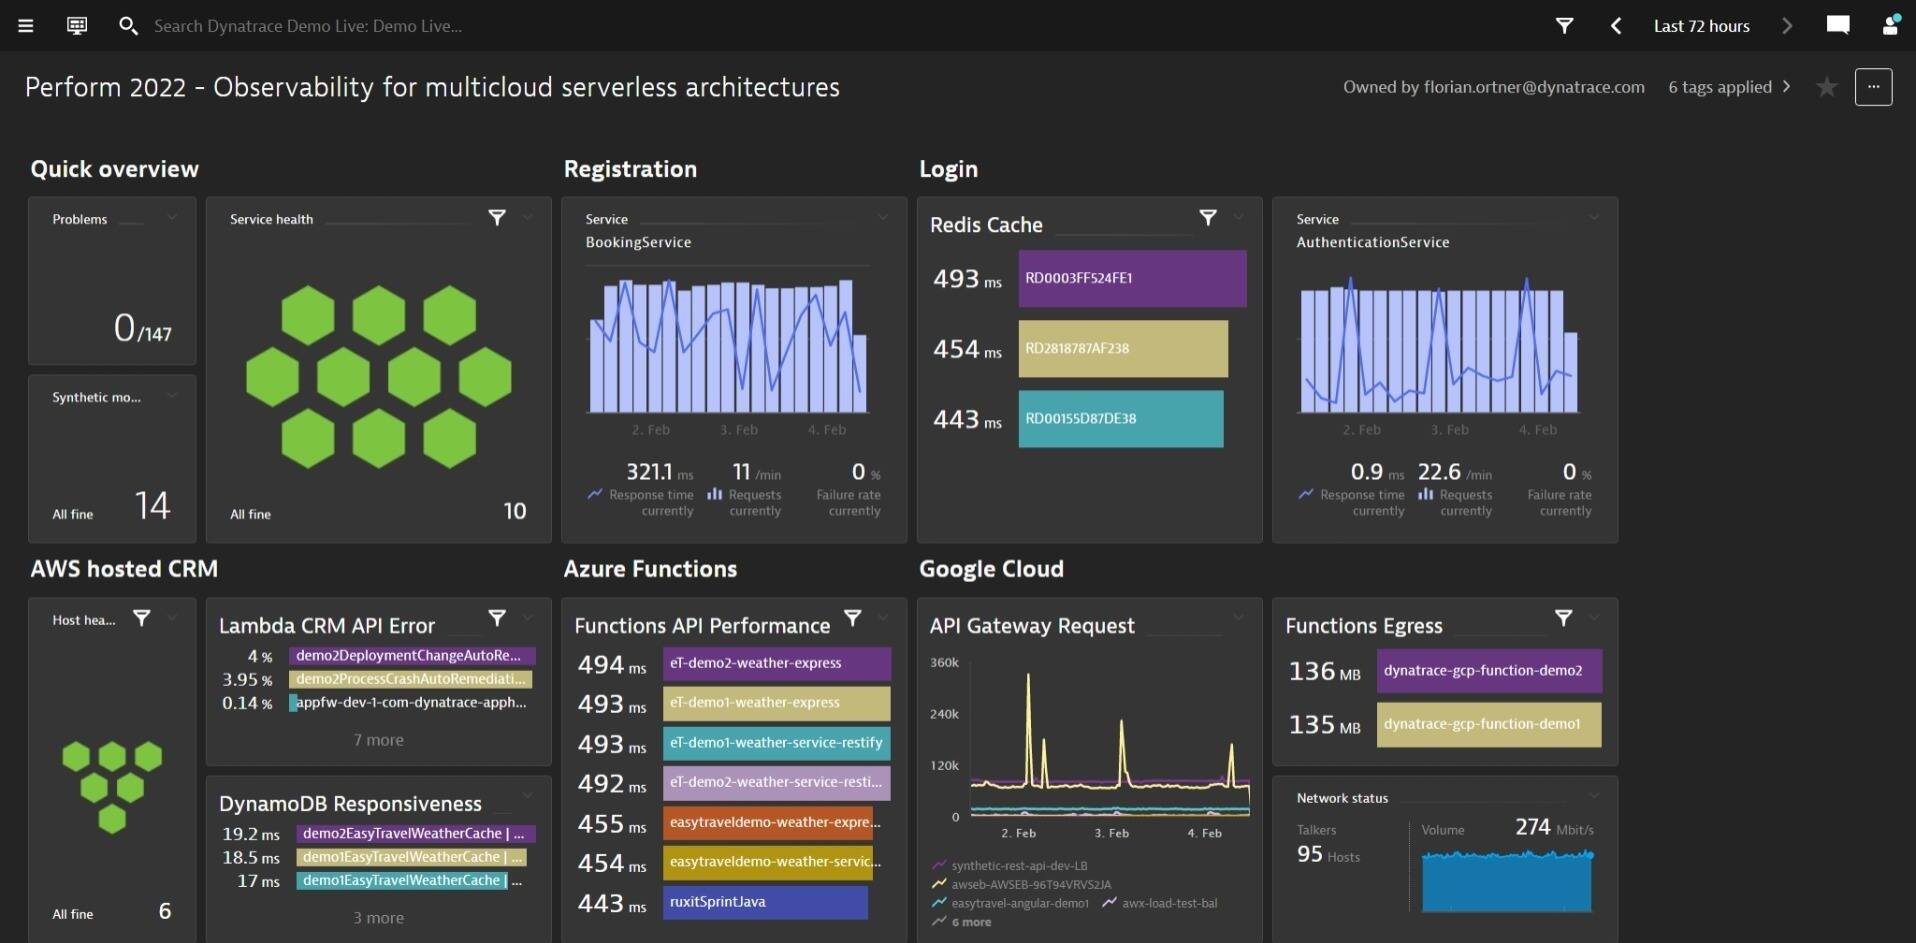
Dynatrace
Dynatrace is an AI-powered observability platform that offers automated monitoring and optimization for AWS environments. It provides comprehensive insights into your applications and infrastructure’s performance, availability, and dependencies. With its distributed tracing capabilities, Dynatrace allows you to analyze the flow of requests across services and identify performance bottlenecks. It also offers advanced features like root cause analysis and automatic anomaly detection.
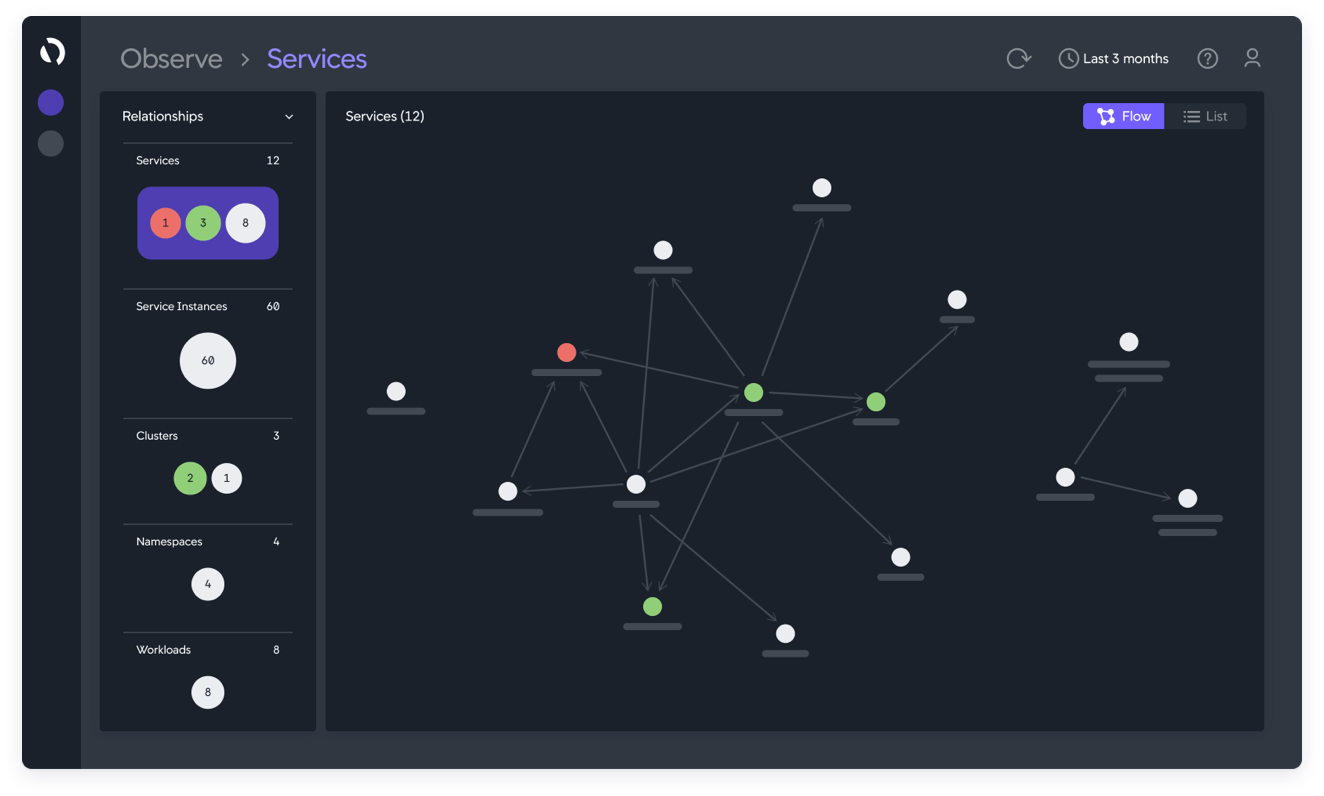
AppDynamics
AppDynamics is an application performance monitoring and observability platform that helps you understand the performance of your applications running on AWS. It provides real-time visibility into end-to-end transactions, code-level diagnostics, and infrastructure monitoring. AppDynamics enables you to identify performance issues, optimize resource allocation, and deliver exceptional user experiences. It offers automatic baselining, anomaly detection, and customizable dashboards.
These third-party tools, including Splunk, DataDog, New Relic, Dynatrace, AppDynamics, ManageEngine Applications Manager, and ManageEngine OpManager, offer advanced features and integrations that can enhance your AWS observability and monitoring capabilities. When considering third-party tools, evaluate their features, integrations, scalability, ease of use, and pricing models to choose the ones that best fit your organization’s requirements and goals.
Please note that including these third-party tools does not imply endorsement or recommendation. We encourage you to evaluate and choose tools based on your specific needs, preferences, and compatibility with your AWS environment.
Conclusion
AWS observability is essential for maintaining your AWS environment’s health, performance, and security. By implementing effective monitoring, logging, and tracing practices, you can gain deep insights into your infrastructure and applications, identify issues proactively, and optimize their performance. In this blog post, we explored various AWS observability services and best practices to help you enhance your monitoring capabilities.
We started by introducing AWS observability and its significance in understanding the behavior and performance of your AWS resources. We discussed the importance of AWS Cloud Monitoring and highlighted key services such as AWS CloudWatch, AWS X-Ray, AWS CloudTrail, and AWS Config. These services offer comprehensive monitoring, tracing, auditing, and configuration management capabilities that are vital for maintaining the reliability and security of your AWS environment.
We also explored AWS ServiceLens, a powerful tool for visualizing application health. With its application dashboard, service maps, end-to-end tracing, and anomaly detection capabilities, ServiceLens provides a holistic view of your application’s performance, helps you identify bottlenecks, optimize resource allocation, and deliver exceptional user experiences.
Furthermore, we delved into best practices for AWS observability, including defining monitoring goals, designing effective metrics and alarms, implementing centralized logging, leveraging distributed tracing with AWS X-Ray, automating monitoring with AWS CloudFormation, and optimizing monitoring costs. These best practices lay the foundation for a comprehensive observability strategy that aligns with your organization’s goals and requirements.
Lastly, we discussed integrating third-party tools with AWS to enhance observability. Middleware solutions like New Relic, Dynatrace, and AppDynamics offer advanced monitoring capabilities, while tools like ManageEngine, Splunk, and DataDog provide additional insights, analysis, and visualization options. These third-party tools can complement AWS’s native services and help you build a robust observability framework tailored to your specific needs.
In conclusion, AWS observability is critical to managing and optimizing your AWS infrastructure and applications. By adopting the services, best practices, and third-party tools discussed in this blog post, you can achieve comprehensive visibility, proactive monitoring, and efficient troubleshooting in your AWS environment. Embrace AWS observability as a core practice to drive better performance, maintain security, and deliver exceptional user experiences.
FAQ
What is observability in AWS?
What are the three pillars of observability in AWS?
What is the difference between observability and monitoring in AWS?
Is CloudWatch an observability tool?
References
During the development of this blog post on AWS observability and cloud monitoring best practices, the following resources were consulted:
- AWS Observability Handbook
- AWS Cloud Adoption Framework (CAF): Observability
- AWS CloudWatch Documentation
- AWS X-Ray Documentation
- AWS CloudTrail Documentation
- AWS Config Documentation
- AWS ServiceLens Documentation
- New Relic
- Dynatrace
- AppDynamics
- ManageEngine Applications Manager
- Splunk
- DataDog
These resources provided valuable information and insights into AWS observability, cloud monitoring services, best practices, and third-party tools. We encourage you to explore these references for further details and in-depth knowledge.
Remember to stay up-to-date with the latest AWS documentation and releases for the most current information on AWS observability and monitoring services.
Disclaimer: Including third-party tools and references does not imply endorsement or recommendation. Please evaluate and choose tools based on your specific requirements and preferences.
