Introduction to Supervised Machine Learning
Supervised Machine Learning is a set of algorithms that train on historical data and then predict output using the training dataset. Because of its accuracy and low time complexity, it is one of the most common machine learning types. Spam filtering, facial recognition, disease identification, fraud detection, and many others are the most common problems Supervised learning can solve. This article will cover different types of Supervised Machine Learning, data sets, and steps involved in the learning process.
Table of contents
In Supervised Machine Learning, you train the model using a labeled dataset containing inputs and corresponding outputs. Here’s what the training process looks like:
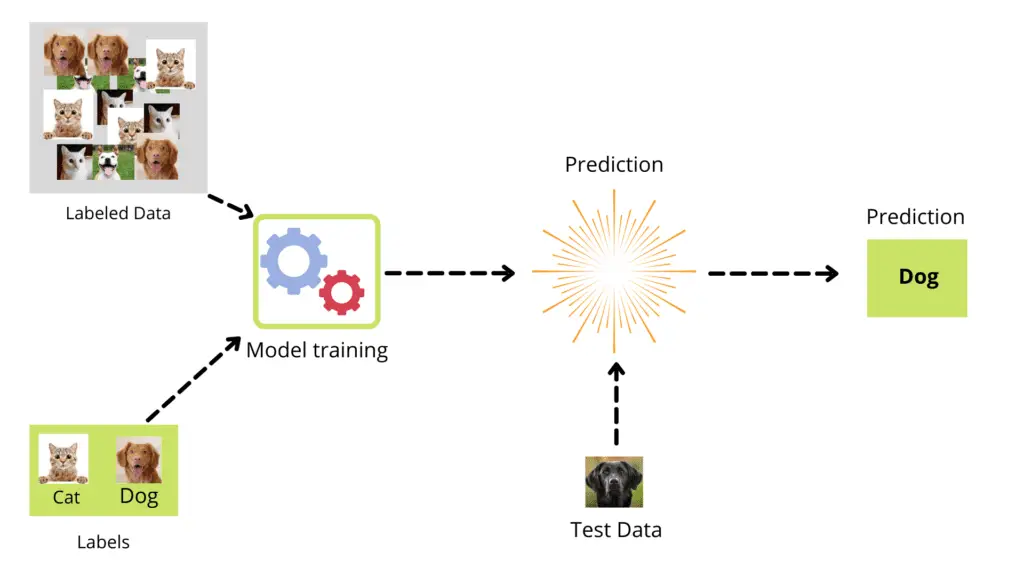
The labeled data contains pictures of dogs and cats (it’s our job to provide the labels for pictures as dog or cat). The algorithm uses this information for training purposes. Once the model is trained, it can predict the input data (unlabeled data/test data) and classify the new picture as a dog or cat.
Datasets in Supervised Machine Learning
A dataset in machine learning is a collection of data pieces that can be considered a single unit by a computer for analytic and prediction purposes. That means that the gathered data should be uniform and understandable by a machine that does not see data in the same manner humans do. In this article, we will take a sample dataset, apply the splitting method, and divide it into training and testing datasets.
Here is a simple dataset of hours and scores, where hours are input (independent variable) and scores (dependent variable).
You can download this dataset from this link.
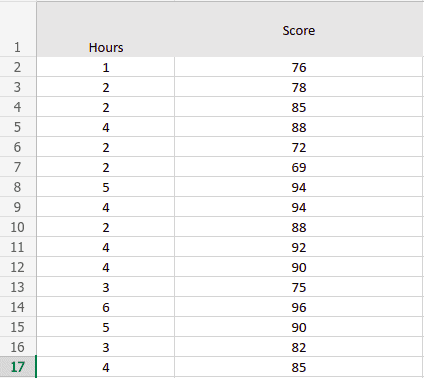
Let’s visualize the given data using Python and the matplotlib library. We will import the data set and split the given data into inputs and outputs using the Pandas module. We’ll use the AWS Sagemaker and Jupyter Notebook to process and visualize the dataset.
# importing the modules
import pandas as pd
import matplotlib.pyplot as plt
# importing the dataset
dataset = pd.read_csv('hours_and_scores.csv')
# get a copy of dataset exclude last column
X = dataset.iloc[:, :-1].values
# get array of dataset in column 2st
y = dataset.iloc[:, 1].values
# visualization part
viz_train = plt
viz_train.scatter(X, y, color='red')
viz_train.title('Hours vs Score')
viz_train.xlabel('Hours')
viz_train.ylabel('Score')
viz_train.show()
Output:
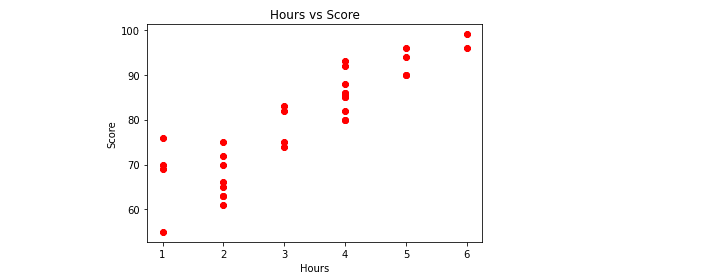
Note: the data seems to have a positive linear correlation because as the input value increases, the output also increases. In Supervised Machine Learning, we feed such a dataset to the machine, and it finds the relation between the inputs and outputs to train itself.
In Supervised Machine Learning, we continually train the machine using the training data set and evaluate the training performance using the testing dataset.
Training dataset in Supervised Machine Learning
The training dataset is the data we use to train Machine Learning models. We fed it to Machine Learning algorithms to teach the machine how to make future predictions for similar data. The ML algorithms use the training data to form relationships, understand them, and make decisions. The model works better when the training data is adequate.
You can classify training datasets as:
- Labeled data is a set of samples labeled with one or more relevant labels. Labels describe certain qualities, traits, categories, or characteristics. In simple words, labeled data have inputs and corresponding outputs. In Supervised learning, labeled training data is used by machine learning models to learn the traits associated with specific labels, which can then be used to classify new data points.
- Unlabeled data: The opposite of labeled data is unlabeled data. Raw data hasn’t been labeled with classifications, features, or attributes. It is utilized in Unsupervised Machine Learning, where ML models have to detect patterns or similarities in data.
While training the model in Supervised Machine Learning, the dataset is usually divided into training and testing datasets. We will use the sklearn module for the splitting of our data set into two categories:
# importing train_test_split method from sklearn
from sklearn.model_selection import train_test_split
# 30% data for testing, random state 0
X_train, X_test, y_train, y_test = train_test_split(X, y, test_size=.3, random_state=0)
This Python code will split our dataset into the training and testing parts.
The following parameters are provided for the train_test_split() method:
Xcontains all the input values of our dataset.ycontains all the output values of our dataset.test_sizespecifies the percentage of the original dataset to use as testing data. In the example above, we have assigned it to 0.3, which means 30% of the whole dataset will be assigned to the testing part, and the remaining 70% of the dataset will be assigned to the training part.random_statecontrols the shuffling applied to the data before applying the split. Use 0 to prevent data from shuffling and 1 to perform shuffling before splitting data.
The X_train will contain 70% of the input values for training purposes and y_train contains 70% of the corresponding output values of the dataset. Supervised Machine learning uses these two datasets to train the model.
Testing dataset in Supervised Machine Learning
After the model is built and training has been done, testing data validates the model to make accurate predictions. After completing the training, it is defined as a separate set of data used to test the model. Simply put, it is a data set containing only input values. It generates an unbiased final model performance metric of precision, accuracy, and other factors that help us know how well our model predicts the unknown output.
In Supervised Machine Learning, the testing data is provided so that the model can make predictions and give us the predicted outputs. These outputs are then compared with the actual data outputs, which help to calculate the performance of the Supervised Learning model.
The X_train variable contains the input values, while the y_test variable contains the outputs of these corresponding inputs.
Dataset visualization and splitting using AWS SageMaker Studio
Amazon SageMaker Studio is a fully managed service that allows data scientists and developers to construct, train, and deploy machine learning models easily and rapidly.It is a web-based, integrated development environment (IDE) for machine learning that lets you build, train, debug, deploy, and monitor your Machine Learning models. Amazon Sagemaker contains Jupyter Notebook, which we’ll use to run all our examples.
The best thing about Amazon SageMaker studio is that we can directly clone any directory for GitHub and start working on it. We can create a new notebook by clicking on the File menu on the top left and selecting a new notebook section. Or we can manually create our new directory and start working from scratch.
Once Jupyter Notebook is created, we can upload our data set and start the visualization part. For the visualization, importing, and splitting dataset, we’ll need the following Python modules:
- pandas
- sklearn
- matplotlib
If they are not installed, you can write the following command in the cell of the SageMaker studio to install them:
%pip install pandas
%pip install matplotlib
%pip install sklearn
Once the modules are installed successfully, we can jump to the visualization part. We will write the same Python code for the visualization of our data.
# importing the modules
import pandas as pd
import matplotlib.pyplot as plt
# importing the dataset
dataset = pd.read_csv('hours_and_scores.csv')
# get a copy of dataset exclude last column
X = dataset.iloc[:, :-1].values
# get array of dataset in column 2st
y = dataset.iloc[:, 1].values
# visualization part
viz_train = plt
viz_train.scatter(X, y, color='red')
viz_train.title('Hours vs Score')
viz_train.xlabel('Hours')
viz_train.ylabel('Score')
viz_train.show()
Output:
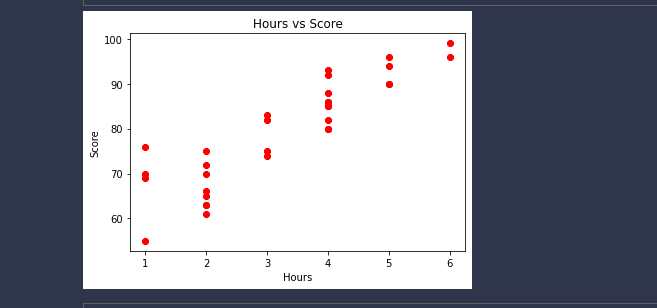
Similarly, we can use the same code to split our dataset into the training and testing parts.
Let’s print the X_train and Y_train:
# importing train_test_split method from sklearn
from sklearn.model_selection import train_test_split
# 30% data for testing, random state 0
X_train, X_test, y_train, y_test = train_test_split(X, y, test_size=.3, random_state=0)
print("Input values:", X_train)
print("Output values:",y_train)
Output:
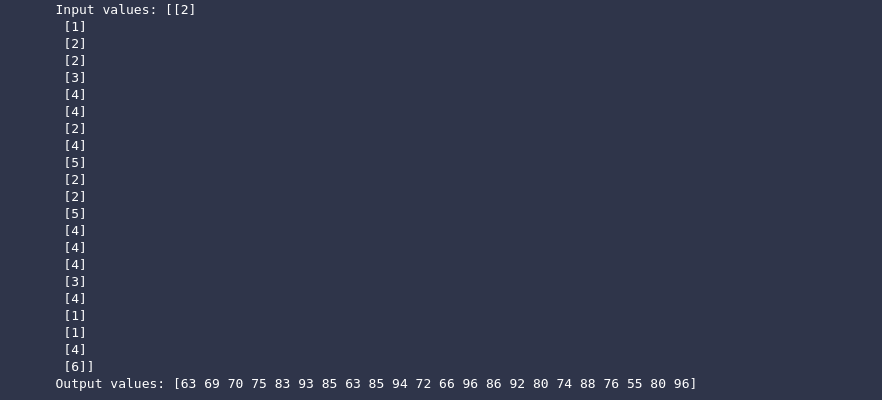
The x_train is in the form of a multi-dimensional array because there can be multiple inputs, but in our data, there was a single input for the corresponding output.
Types of Supervised Machine Learning
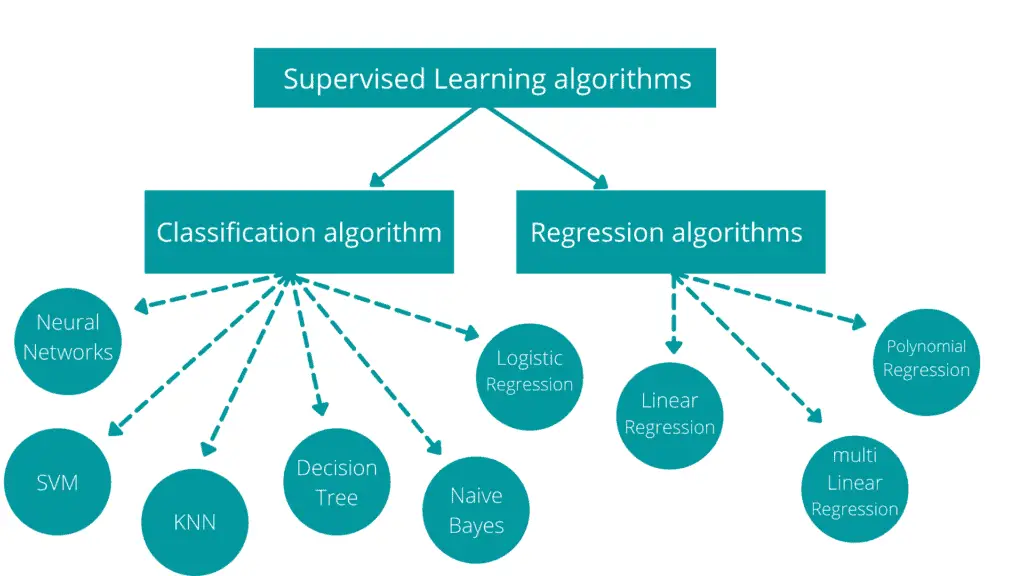
On a broader scale, Supervised Machine Learning can be divided into two main classes: classification and regression. When the output class is discrete or categorical, it is called classification; when the output class contains continuous values, it is called a regression.
You choose a specific algorithm depending on the problem you’re solving.
Classification
Classification is a type of Supervised Machine Learning that helps to learn relationships between input features and an output variable while separating the data into classes or groups, for example, yes/no, dog/cat, True/False, disease prediction, etc. The dataset we use to feed our model in Supervised learning contains only numbers, not words or phrases.
There are two classes of classification problems in Supervised learning:
- Binary classification: only two possible output classes are available, for example, yes/no, true/false, 1/0.
- Multi-class classification: more than two possible output classes are available, for example, grades in class, types of movies, types of diseases, etc
Regression
Regression helps to learn relationships and correlations between input features and a continuous output variable (predicting the continuous output variable). For example, predicting temperature depending on weather conditions, stock price depending on other stocks, etc. In comparison with classification, output values can have infinite possible outputs.
There are two classes of regression problems in Supervised learning:
- Simple Regression: there is a linear relationship between input and output values, or there is only one input and one corresponding output. For example, age depends on height, car velocity depends on acceleration, etc.
- Multi-regression: there are multiple independent variables and one dependent variable in the dataset, For example, market trends, weather forecasting, and many more.
The main difference between regression and classification is that the output variable in the regression is numerical (or continuous), while classification is categorical (or discrete).
Classification Algorithms
Classification is the process of objects’ categorization by classes based on features (data points). Classification can be divided into two main categories: binary and multi-class classifications. Classes are sometimes called targets, labels, or categories.
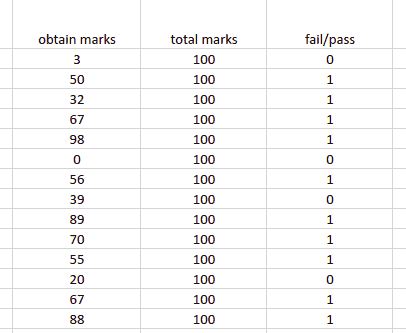
Binary Classification: the output category has only two classes. For example, spam detection in email service providers can be identified as a binary classification as only two classes are available (spam and not spam). The following dataset is an example of binary classification, with only two possible outcomes (fail/pass column).
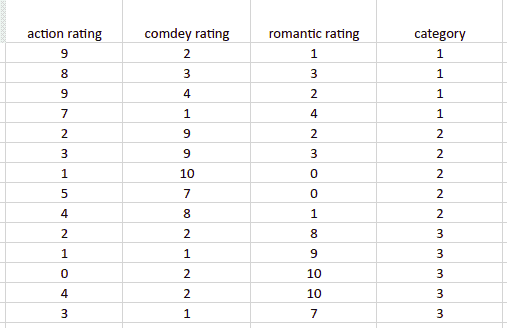
Multi-class classification: the output category has more than two classes. For example, we can classify a movie as a comedy, romantic, or action using a multi-class classification. The movie genre in this example will have three possible output classes. The following dataset represents an example of multi-class classification with three possible outcomes.
KNN Classification Algorithm
The KNN (K-nearest neighbor) algorithm assumes that items similar to each other are close together. KNN algorithm aims to predict the right class for the test data by computing the distance between the test data and all training points. The KNN algorithm calculates the likelihood of test data belonging to each of the ‘K’ training data classes, then chooses the class with the highest probability. Then it selects the K number of points closest to the test data.

KNN is a lazy learner algorithm because it memorizes the training dataset rather than learning a discriminative function. In KNN, there is no training time. The prediction/classification step is computationally costly because when we want to make a prediction, KNN calculates distances throughout the entire dataset to find the nearest neighbors.
In the KNN algorithm, the nearest neighbors are data points with the shortest distance in feature space from the new data point. The K represents the data points we consider in our algorithm implementation. As a result, the KNN algorithm has two key factors: the distance metric and the K value. Euclidean distance is the most popular distance metric used in the KNN algorithm.
Naive Bayes Algorithm
It’s a classification technique based on Bayes’ Theorem and the predictor independence assumption. In simple terms, a Naive Bayes classifier assumes that one feature in a class does not affect the presence of any other feature. This approach is typically used in classification problems where the classes/features are unrelated or independent.
For example, if the fruit is red, round, and roughly 3 inches in diameter, it may be considered an apple. Even if these characteristics are reliant on one another or the presence of other characteristics, they all independently contribute to the probability that this fruit is an apple, which is why it is called Naive.
The Naive Bayes model is simple to construct and is especially good for huge data sets. Naive Bayes is renowned for outperforming even the most advanced classification systems due to its simplicity.
The following formula is used in the Naive Bayes algorithm to predict the output class.

P(c|x)is the posterior probability of class (c, target) given predictor (x, attributes)P(c)is the prior probability of classP(x|c)– the likelihood, which is the probability of predictor given classP(x)– the prior probability of predictor
Decision Tree Algorithm
The Decision Tree algorithm is the most powerful and widely used tool for categorization and prediction. A Decision Tree is a flowchart-like tree structure in which each internal node represents an attribute test. Each branch reflects the test’s outcome, and each leaf node (terminal node) stores a class label.
Using a Decision Tree algorithm aims to create a training model that can predict the class or value of the target variable by learning simple decision rules inferred from the historical data.
The following is the simple form of the decision tree.
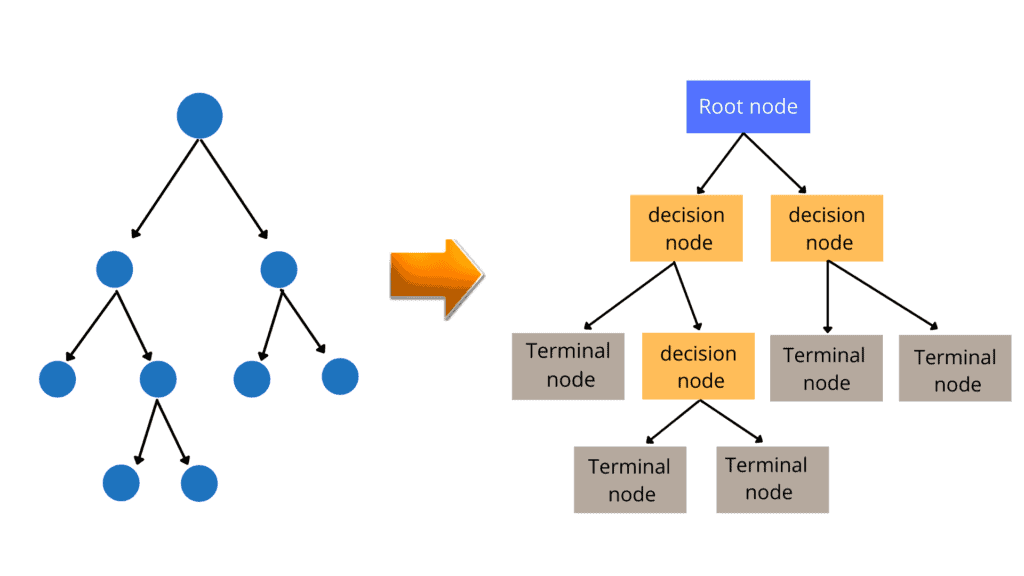
- Root Nodes: It is the node present at the beginning of a decision tree from this node, the population starts dividing according to various features.
- Decision Nodes: The nodes we get after splitting the root nodes are called Decision Node
- Terminal Nodes: The nodes where further splitting is not possible are called leaf nodes or terminal nodes
- Sub-tree: A small portion of a graph is called a sub-graph. Similarly, a sub-section of this decision tree is called a sub-tree.
Support Vector Machine (SVM)
The Support Vector Machine (SVM) is a common Supervised Learning technique for solving classification and regression problems. However, it is mostly used in Machine Learning to solve classification problems. The goal of the SVM algorithm is to find the best line or decision boundary for categorizing n-dimensional space into classes so that machine can easily place subsequent data points in the right category.
Hyperplanes are decision boundaries that help classify the data points. This line is called a hyperplane in N-dimensional space (N — the number of features), and this line distinguishes between data points. Data points falling on either side of the hyperplane can be attributed to different classes.
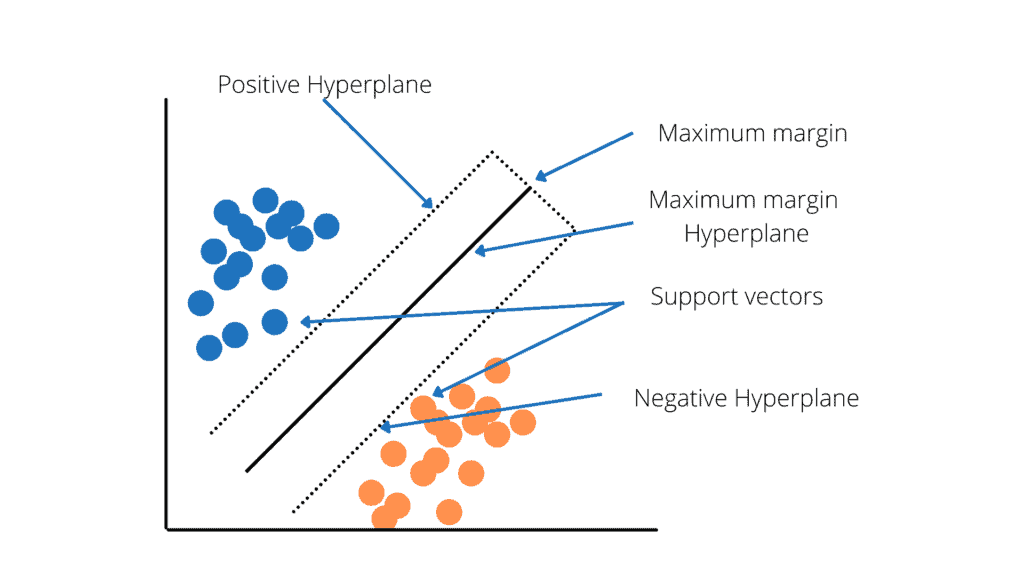
SVM classification is used in face detection. It classifies parts of the image as a face and non-face and creates a square boundary around the face. SVMs allow text and hypertext categorization for both inductive and transductive models. They use training data to classify documents into different categories. Moreover, the SVM algorithm identifies the classification of genes, patients based on genes, and other biological problems.
Logistic Regression Algorithm
Modeling the probability of a discrete result given an input variable is known as Logistic Regression. The most frequent logistic regression models have a binary outcome, which might be true or false, yes or no, and so on. For example, we may want to know the probability of the visitor choosing an offer on your website. The Logistic regression models can help us determine the visitor’s probability of accepting the offer based on the visitor’s features (age, sex, geolocation, interests, etc.). As a result, we can make better decisions about promoting our offer or the offer itself.
The logistic regression algorithm uses a sigmoid function, which is a mathematical function having a characteristic “S”-shaped curve or sigmoid curve as shown below;

Neural Network
A Neural Network or Artificial Neural Network is a set of algorithms that attempts to recognize underlying relationships in a data set using a similar method to how the human brain works. Neural networks can adapt to changing input and produce the best possible outcome without redesigning the output criteria.
The structure of the Neural network is a little bit complicated. An input layer, one or more hidden layers, and an output layer from nodes form a neural network. Each node, or artificial neuron, is connected to the others and has a weight and threshold. If the node’s output exceeds a certain threshold value, the node is activated, and data is sent to the next layer of the network. Otherwise, no data is sent to the next layer through this node.

No activation function is applied on the input layer, but depending on the data type and problem, different activation functions are applied on the hidden and output layers. For example, the sigmoid function is applied on the output layer in the case of a binary classification problem, and the softmax function is applied if it is a multi-class classification problem.
Regression algorithms in Supervised Machine Learning
Regression analysis is a statistical method to model the relationship between a dependent (target) and independent (predictor) variables with one or more independent variables. It predicts continuous/real values such as temperature, age, salary, price, etc. The following dataset represents a regression problem if we want to predict the height based on the age input.

Notice that the output class contains continuous values, not categorical or discrete.
Linear Regression Algorithm
Linear regression finds the linear relationship between the target and one or more predictors. We should first evaluate whether or not there is a link between the variables of interest before attempting to fit a linear model to observed data. A scatterplot can be helpful when determining the strength of a relationship between two variables. If the postulated explanatory and dependent variables appear to have no relationship (i.e., the scatterplot shows no increasing or decreasing trends), fitting a linear regression model to the data is unlikely to produce a useful model.
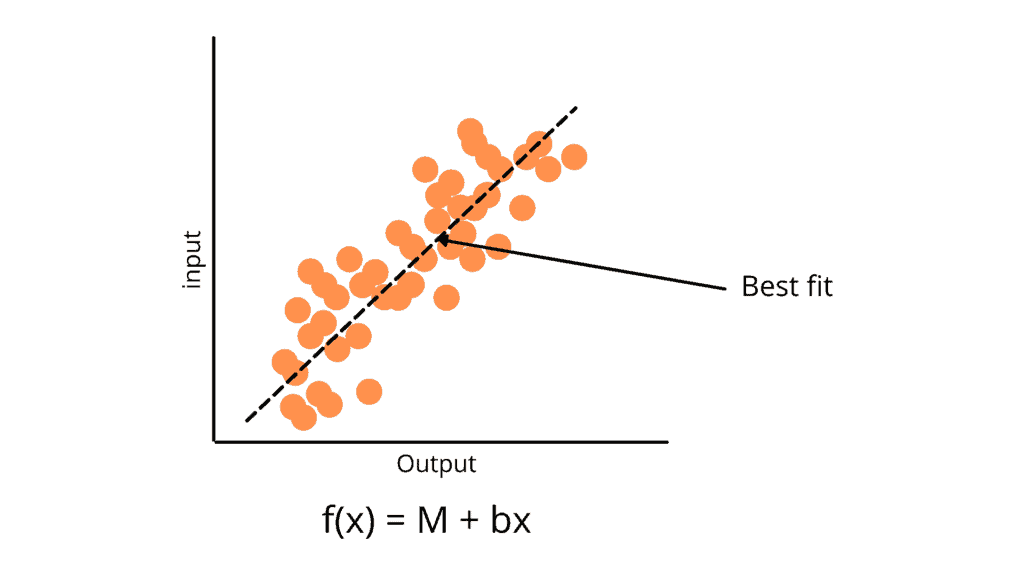
Based on the number of input or independent variables, linear regression can be divided into two sub-categories.
- Simple Linear Regression: Simple linear regression is useful for finding relationships between two continuous variables. For every independent variable, there is a corresponding dependent variable. For example, a simple linear regression problem is the relationship between age and height.
- Multiple Linear Regression: Multiple linear regression is useful for finding relationships between more than two continuous variables. For every dependent variable, there are multiple corresponding independent variables. For example, temperature prediction has multiple input variables like wind, humidity, sunny, cloudy, etc.
Polynomial Regression Algorithm
Polynomial regression is a regression approach that uses an N-th degree polynomial to represent the relationship between dependent and independent variables. It is a special case of Linear Regression in which the data is fitted with a polynomial equation having a curvilinear relationship between the dependent and independent variables.
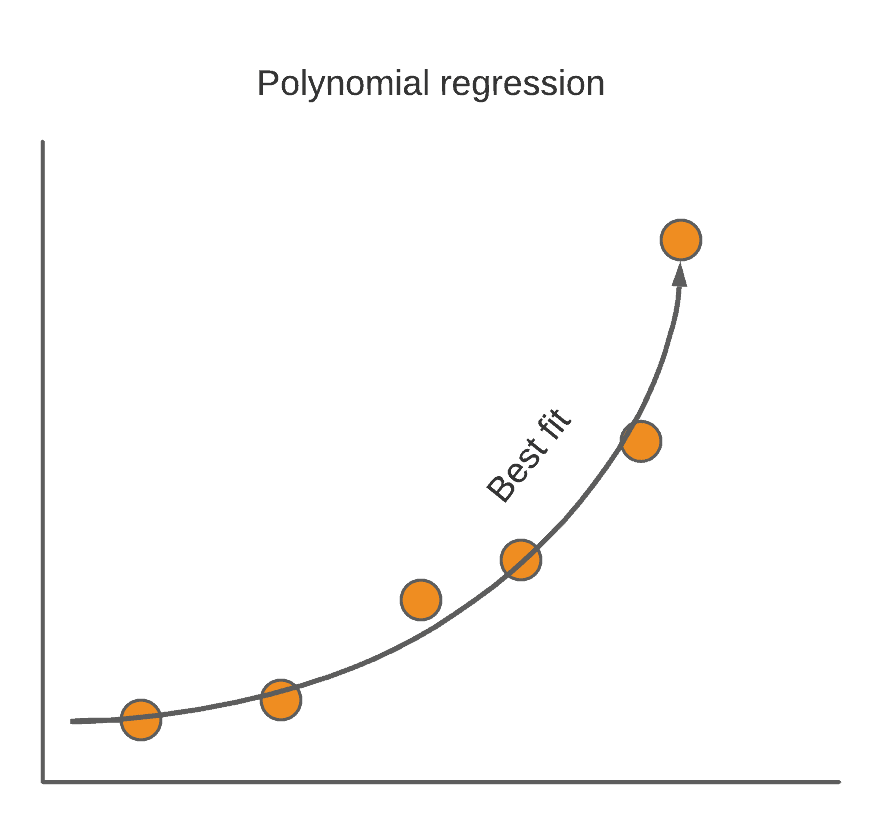
Steps involved in Supervised Machine Learning
The following simple steps are involved in Supervised Machine Learning
- Review the dataset and understand what kind of prediction our model is going to make (classification or regression)
- Label dataset
- Split the dataset into training and testing datasets
- Define the input features of the training dataset (features should have enough data so that the model can accurately predict the output)
- Define the suitable algorithm for the model depending on the type of dataset.
- Apply the algorithm to the training dataset.
- Evaluate the accuracy of the model using the test dataset. If the model predicts the correct output, that means the model is accurate and ready for production use.
Advantages and disadvantages of Supervised Machine Learning
There can be many pros and cons of Supervised Machine Learning depending on the type of problem and dataset.
Advantages
- The model can predict the result based on prior experiences
- In Supervised learning, we can have a clear concept of the output classes
- Supervised learning is a simple process to understand. When it comes to unsupervised learning, we don’t always know what’s going on within the machine and how it is learning
- We don’t need to keep the training data in our memory after we’ve completed the entire training. Instead, the decision boundary can be kept as a mathematical formula
- Helps us to optimize performance criteria using experience
- Supervised learning can be very helpful in classification problems
- We can use the Supervised learning model to handle a variety of real-world problems, such as fraud detection and spam filtering, for example
Disadvantages
- Models of Supervised learning are not suitable for dealing with complicated tasks
- If the test data differs from the training dataset, Supervised learning might not be able to predict the proper output
- When it comes to classification, if we provide input that is not from any of the classes in the training data, the result could be an incorrect class label. Let’s imagine we used data from cats and dogs to train an image classifier. If we give a giraffe image, the output could be either a cat or a dog, which is incorrect.
- Training required lots of computation times
- It cannot cluster or classify data by discovering its features on its own
- Input features that aren’t relevant to the training data could lead to inaccurate outcomes
AWS Machine Learning services
Amazon Web Services is one of the most popular public cloud providers, offering a wide range of cloud services and technologies. AWS provides a wide and deep variety of Machine Learning and AI services for different businesses. The AWS Machine Learning tools and services are primarily intended to assist customers in overcoming crucial issues that prevent developers from fully utilizing the power of ML. In addition, AWS offers AWS Sagemaker Studio for creating, training, and deploying LM models more quickly at scale. Sagemaker’s users can also create custom models while maintaining compatibility with major open-source frameworks.
Here’s a list of some of the AWS built with machine learning support:
- Amazon Fraud Detector simplifies the time-consuming and costly steps of building, training, and deploying an ML model for fraud detection, allowing customers to take advantage of the technology more quickly. The accuracy of models created by Amazon Fraud Detector is higher than that of current one-size-fits-all machine learning solutions since each model is customized to a customer’s specific dataset.
- Amazon HealthLake: In the AWS Cloud, healthcare providers can utilize HealthLake to store, transform, query, and analyze data. We can evaluate unstructured clinical material from a variety of sources using the HealthLake integrated medical natural language processing (NLP) capabilities.
- Amazon Lex is a service for integrating speech and text-based conversational interfaces into any application. Lex offers advanced deep learning capabilities such as automatic speech recognition (ASR) for converting speech to text and natural language understanding (NLU) for recognizing the text’s intent, allowing you to create apps with highly engaging user experiences and lifelike conversational interactions.
- Amazon Lookout for Equipment analyzes data from our equipment’s sensors to automatically develop a Machine Learning model for our equipment using just our data.
- Amazon Lookout for Metrics: Anomalies (i.e. outliers from the norm) in business and operational data, such as a rapid drop in sales revenue or customer acquisition rates, are automatically detected and diagnosed by Amazon Lookout for Metrics.
- Amazon Lookout for Vision is a machine learning service that uses computer vision to detect flaws and anomalies in visual representations. Manufacturing companies can improve quality and cut costs with Amazon Lookout for Vision by swiftly detecting discrepancies in images of products at scale.
- Amazon Monitron is a complete solution that employs machine learning to detect anomalous behavior in industrial machinery, allowing us to perform predictive maintenance and minimize unexpected downtime.
Summary
Supervised Machine Learning is a type of Machine Learning that needs historically labeled data to make predictions by training the model. It is considered to be one of the most accurate ML methods. Some real-life examples where Supervised Machine Learning takes place are spam filtering, recommendation system, weather prediction, stock value prediction, etc. In this article, we covered Supervised Machine Learning and some Machine Learning services provided by AWS cloud.
